Applying Network Security using VPC Flow Logs with Terraform
So you've deployed a few resources on AWS, EC2, and Redis instance, exposed port 6379, and made sure other resources in the VPC have access to the Redis instance and all.
You've tried hardening by default for your resources, that's good, but by mistake, your Redis instance was deployed into the public subnets, which makes the service accessible by any internet user.
Detecting this might take time, but having the practices of monitoring/insights of what's happening at the network traffic level across your resources which you've deployed under a VPC service is the best bet to detecting this
That brings us to VPC Flow Logs
What are VPC Flow Logs?
Virtual Private Cloud Flow Logs (VPC Flow Log) is an aws service that helps in logging relevant traffic to the Cloudwatch log, provided you've enabled it for your VPC.
But you can achieve more by sending the logs to the s3 storage bucket to analyze the captured network traffic, either by using any of the aws querying services or other third-party tools.
The data logged by vpc logs are byte counts, source and destination ports, IP Addresses, start time and end time of the flow, protocol number, actions, and traffic type, either ACCEPT, REJECT or ALL.
It doesn't log requests for privately hosted zones, traffic, or queries about instance metadata.
With the aid of Cloudwatch, you can trigger alarms based on metrics for spotting patterns and anomalies in the logs.
Prerequisite
- Existing knowledge about terraform
- AWS account
- A new vpc or use the default vpc
So Let's jump into it;
Setting up VPC Flow Log using Terraform
Firstly, you might need to create a new folder named vpc-flow-logs, then create two new files named main.tf and provider.tf in the folder.
Open the provider.tf and configure your cloud provider, copy the below code.
provider "aws" {
  region  = "AWS REGION"
  profile = "AWS PROFILE"
}

terraform {
  required_version = ">= 1.5.7"
  required_providers {
    aws = {
      source  = "hashicorp/aws"
      version = ">= 5.18.1"
    }
  }

  backend "s3" {
    bucket = "iac-terraform" # you can replace the bucket name with your own s3 bucket
    key    = "vpcflowlogs/terraform.tfstate"
    region = "AWS REGION"
  }
}
replace the AWS REGION and AWS PROFILE value with the aws region you are working with, once done, open the main.tf file to configure the s3 bucket and VPC logs.
resource "aws_s3_bucket" "vpc_flow_logs" {
  bucket = "vpc-flow-logs-book"

  versioning {
    enabled = true
  }

  lifecycle {
    prevent_destroy = true
  }
}

resource "aws_flow_log" "appsec-preprod" {
  log_destination      = aws_s3_bucket.vpc_flow_logs.arn
  log_destination_type = "s3"
  traffic_type         = "ALL"
  vpc_id               = "YOUR VPC ID"

  # Enable the new meta fields
  log_format = "$${version} $${vpc-id} $${subnet-id} $${instance-id} $${interface-id} $${account-id} $${type} $${srcaddr} $${dstaddr} $${srcport} $${dstport} $${protocol} $${packets} $${bytes} $${start} $${end} $${action} $${tcp-flags}"

  tags = {
    Name = "vpc_flow_logs"
  }
}
The above code will create an s3 bucket and and VPC flow logs which the s3 bucket created is attached to as the destination for storing all the logs captured, also notice value of the traffic type is stated as ALL, you can replace it with either ACCEPT or REJECT.
You also need to replace the YOUR VPC ID with your newly created VPC ID or the default VPC ID, you can find it in the VPC Console Dashboard
for the log format input, it's an optional value, but it's there to just show how you want the logs to be lined up and stored in the s3 bucket.
well you are not done yet, since the end game also includes querying our logs to analyze the logs, you can easily do that using the AWS Athena service, so let's go back to our main.tf file and paste the following codes.
# create a new athena database from our vpc logs s3 bucket
resource "aws_athena_database" "appsec" {
  name   = "appsec"
  bucket = aws_s3_bucket.vpc_flow_logs.id
}

# create athena query table
resource "aws_athena_named_query" "create_table" {
  name      = "vpc_appsec_logs"
  workgroup = "primary"
  database  = aws_athena_database.appsec.name
  query     = <<EOF
  CREATE EXTERNAL TABLE IF NOT EXISTS vpc_appsec_flow_logs (
  version int,
  account string,
  interfaceid string,
  sourceaddress string,
  destinationaddress string,
  sourceport int,
  destinationport int,
  protocol int,
  numpackets int,
  numbytes bigint,
  starttime int,
  endtime int,
  action string,
  logstatus string
)
PARTITIONED BY (dt string)
ROW FORMAT DELIMITED
FIELDS TERMINATED BY ' '
LOCATION 's3://YOUR_S3_BUCKET_NAME/AWSLogs/YOUR_AWS_ACCOUNT_ID/vpcflowlogs/YOUR_AWS_REGION'
TBLPROPERTIES ("skip.header.line.count"="1");
EOF
}
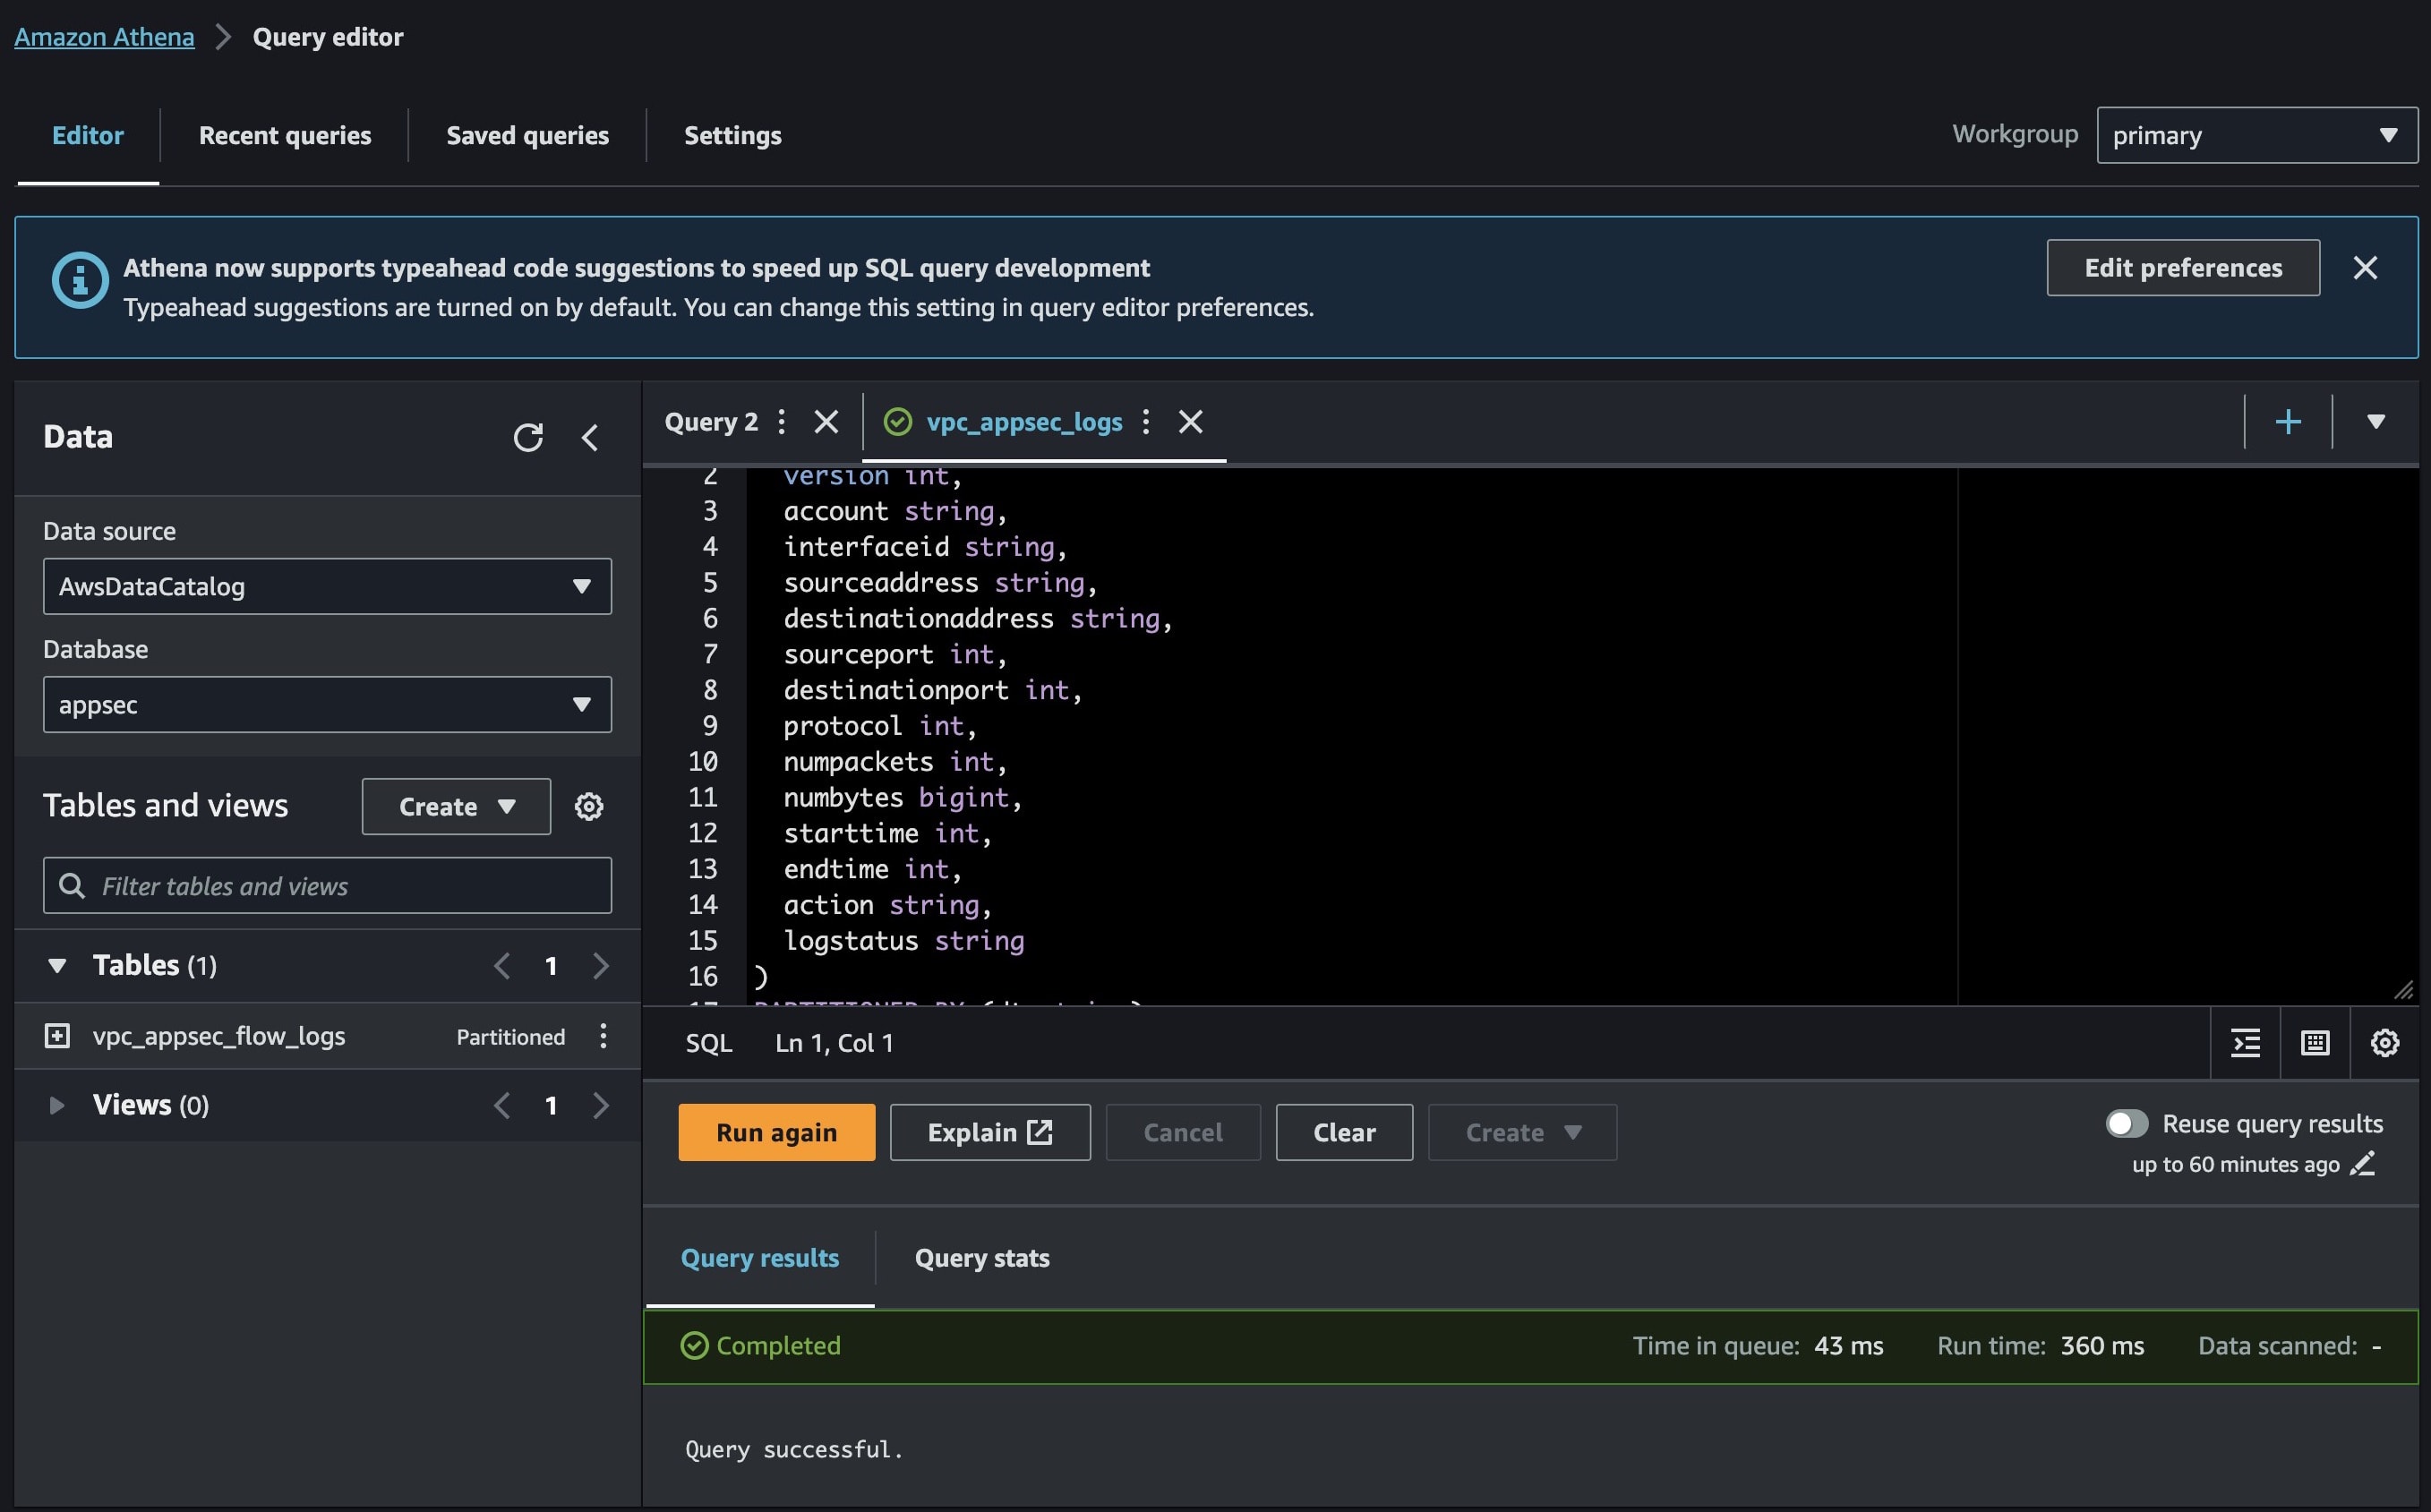
The above code will create an Athena database from your logs in the s3 bucket you created earlier and then you can proceed to create the first query to create a TABLE with the Athena database you just created in the primary workgroup.
Once you are done with the code, you can go ahead to run terraform init && terraform plan && terraform apply -auto-approve
If the deployment is completed, you can hold for a few minutes then go to the Athena service using the aws console to start querying the logs.
The table query you just deployed can be found in the saved query tabs, click on it, then hit the RUN button.


Then you can start running different queries to get more insights about the log, just the way to interact with your SQL DB for example you want to filter the logs based on the destination IP address, since you know the destination IP address, you can run the following query.
SELECT * FROM vpc_appsec_flow_logs WHERE destinationaddress='%172.24%';
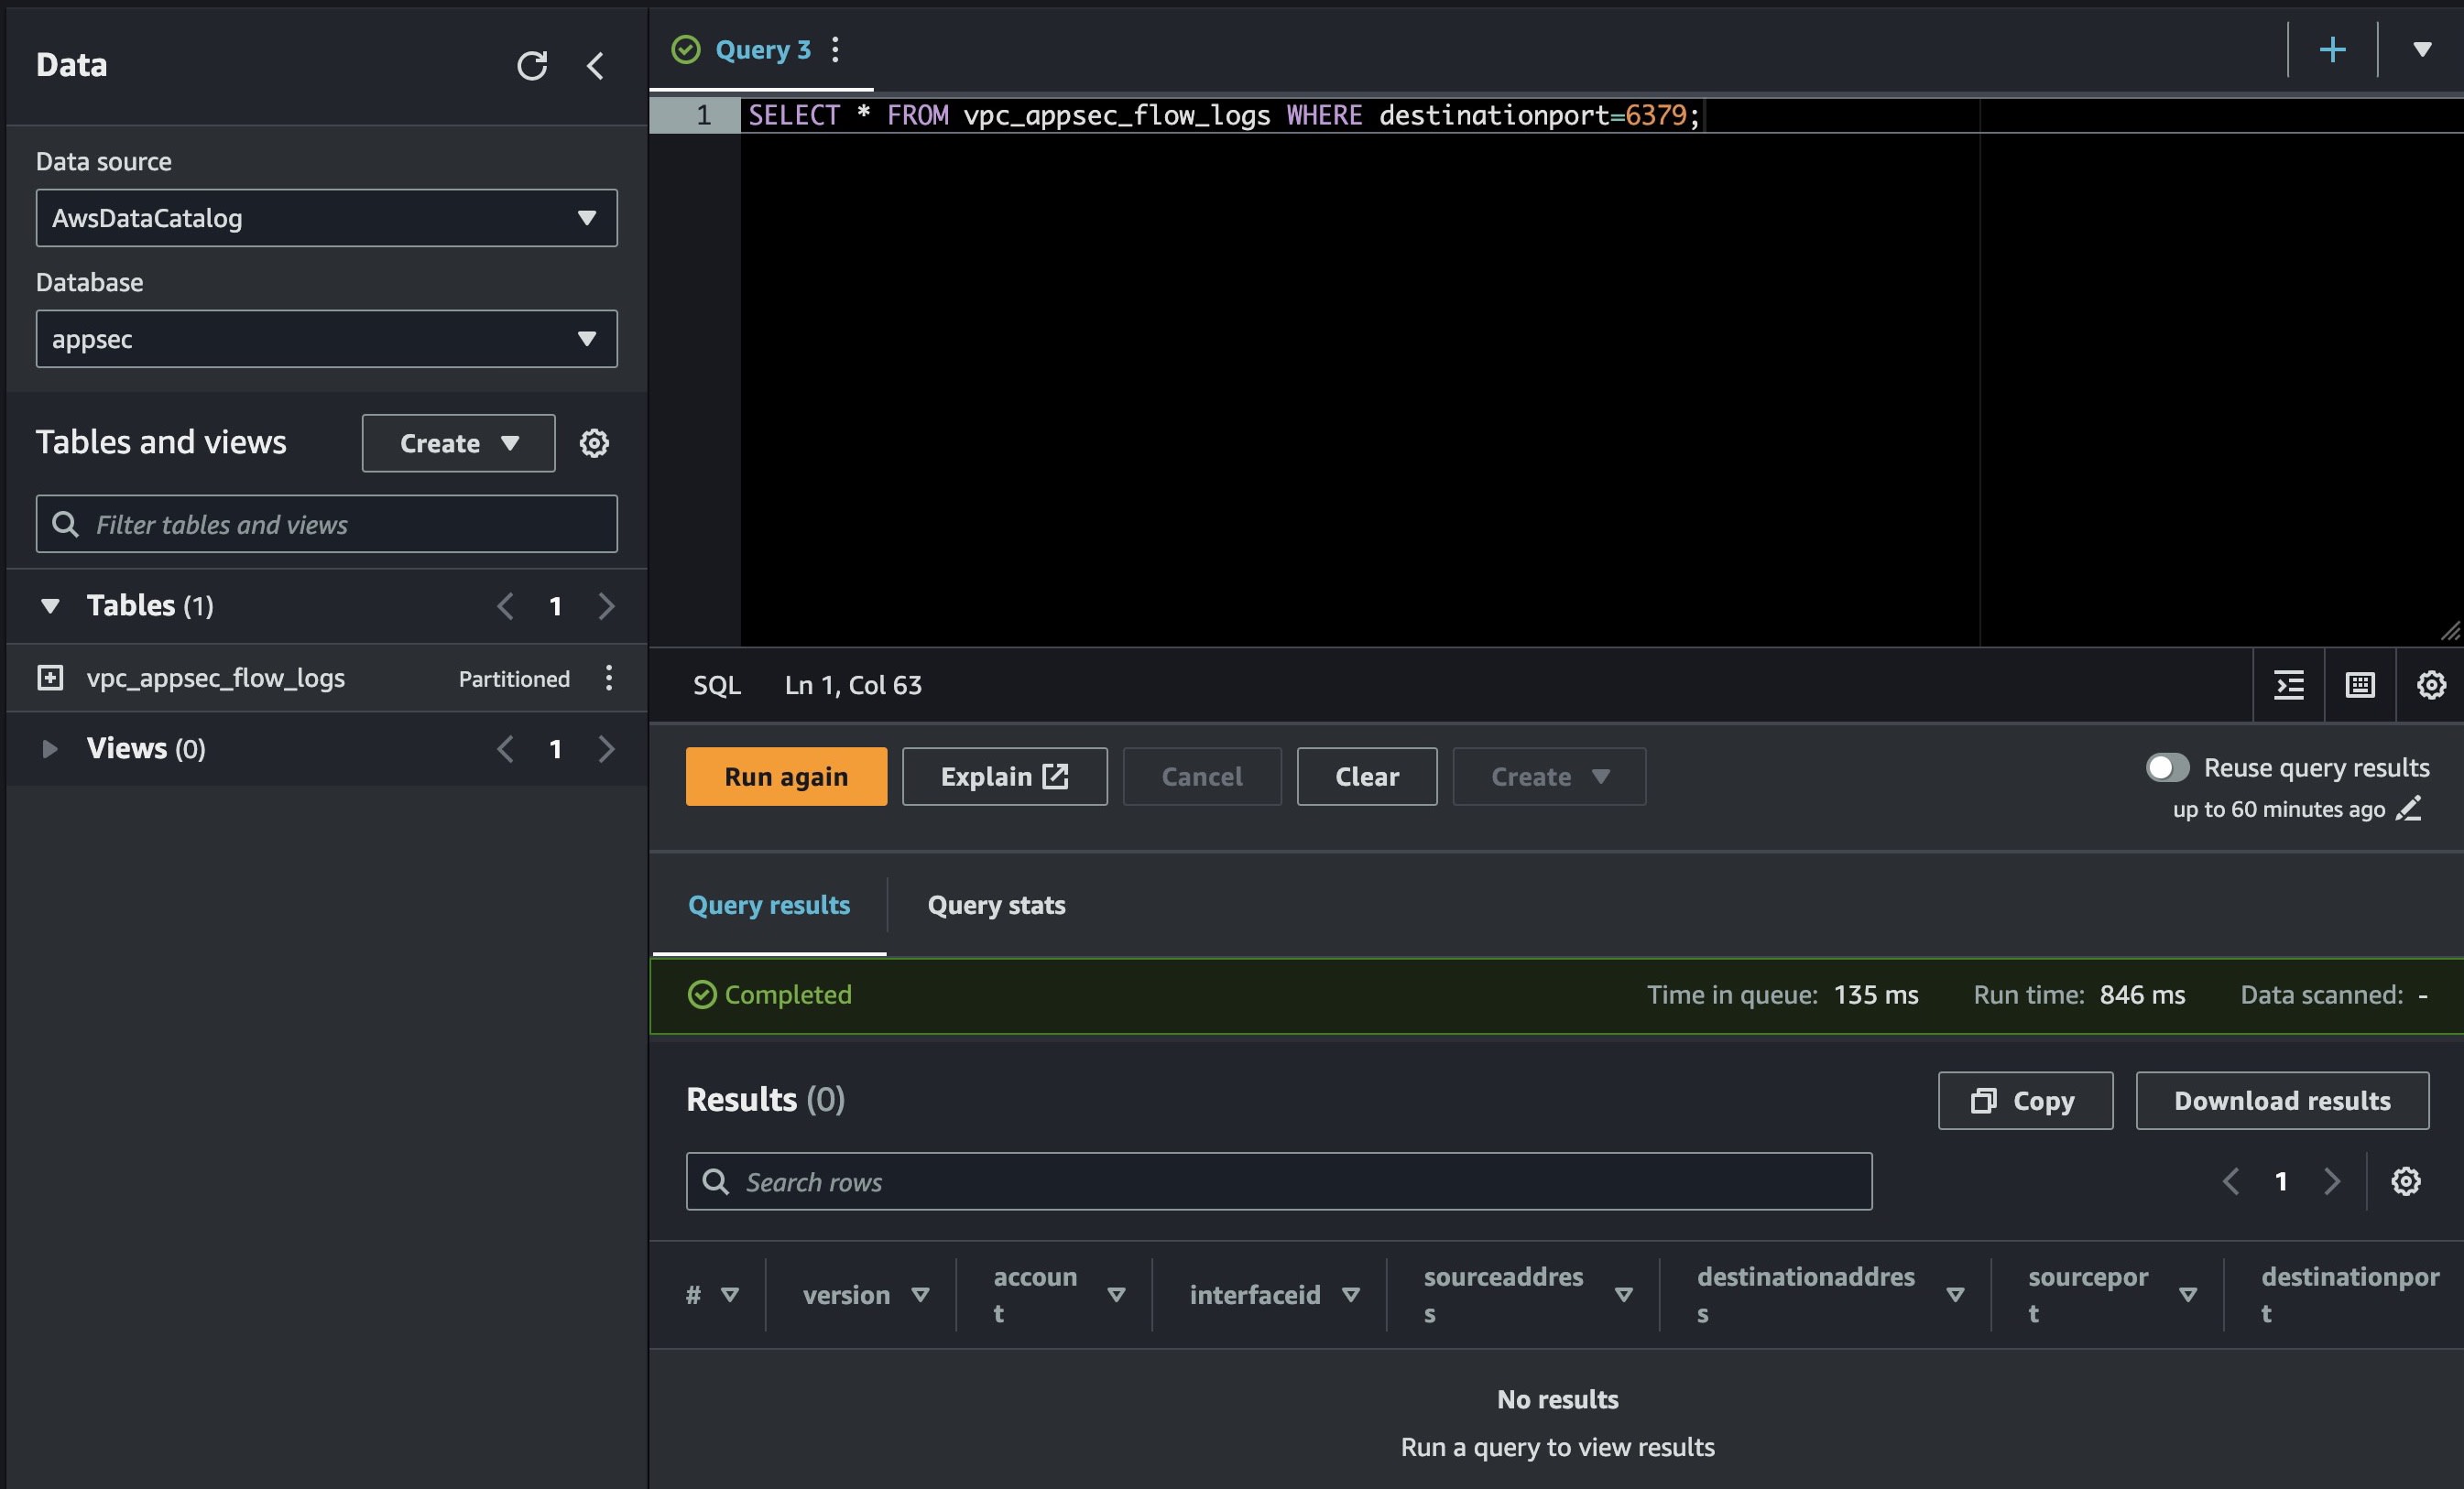
To filter traffic hitting service with port 6379, you will run the folowing query
SELECT * FROM vpc_appsec_flow_logs WHERE destinationport=6379;

That's it folks, the more queries you can craft the better the insights you will have about what's happening at the network traffic level across your VPCs.
I hope you find this piece insightful and helpful.
Till next time 🤞🏽
References
- https://registry.terraform.io/providers/hashicorp/aws/latest/docs/resources/flow_log
- https://registry.terraform.io/providers/hashicorp/aws/latest/docs/resources/athena_named_query
- https://docs.aws.amazon.com/vpc/latest/userguide/flow-logs.html
