Building a Kubernetes IR Playbook: Audit Logs Alone Won't Save You

If you stay in this space long enough, you'll one day face real incident before you retire, pivot, or quietly stop answering pages. Dont let it catch you off guard, compose and face it, haha, its your turn.
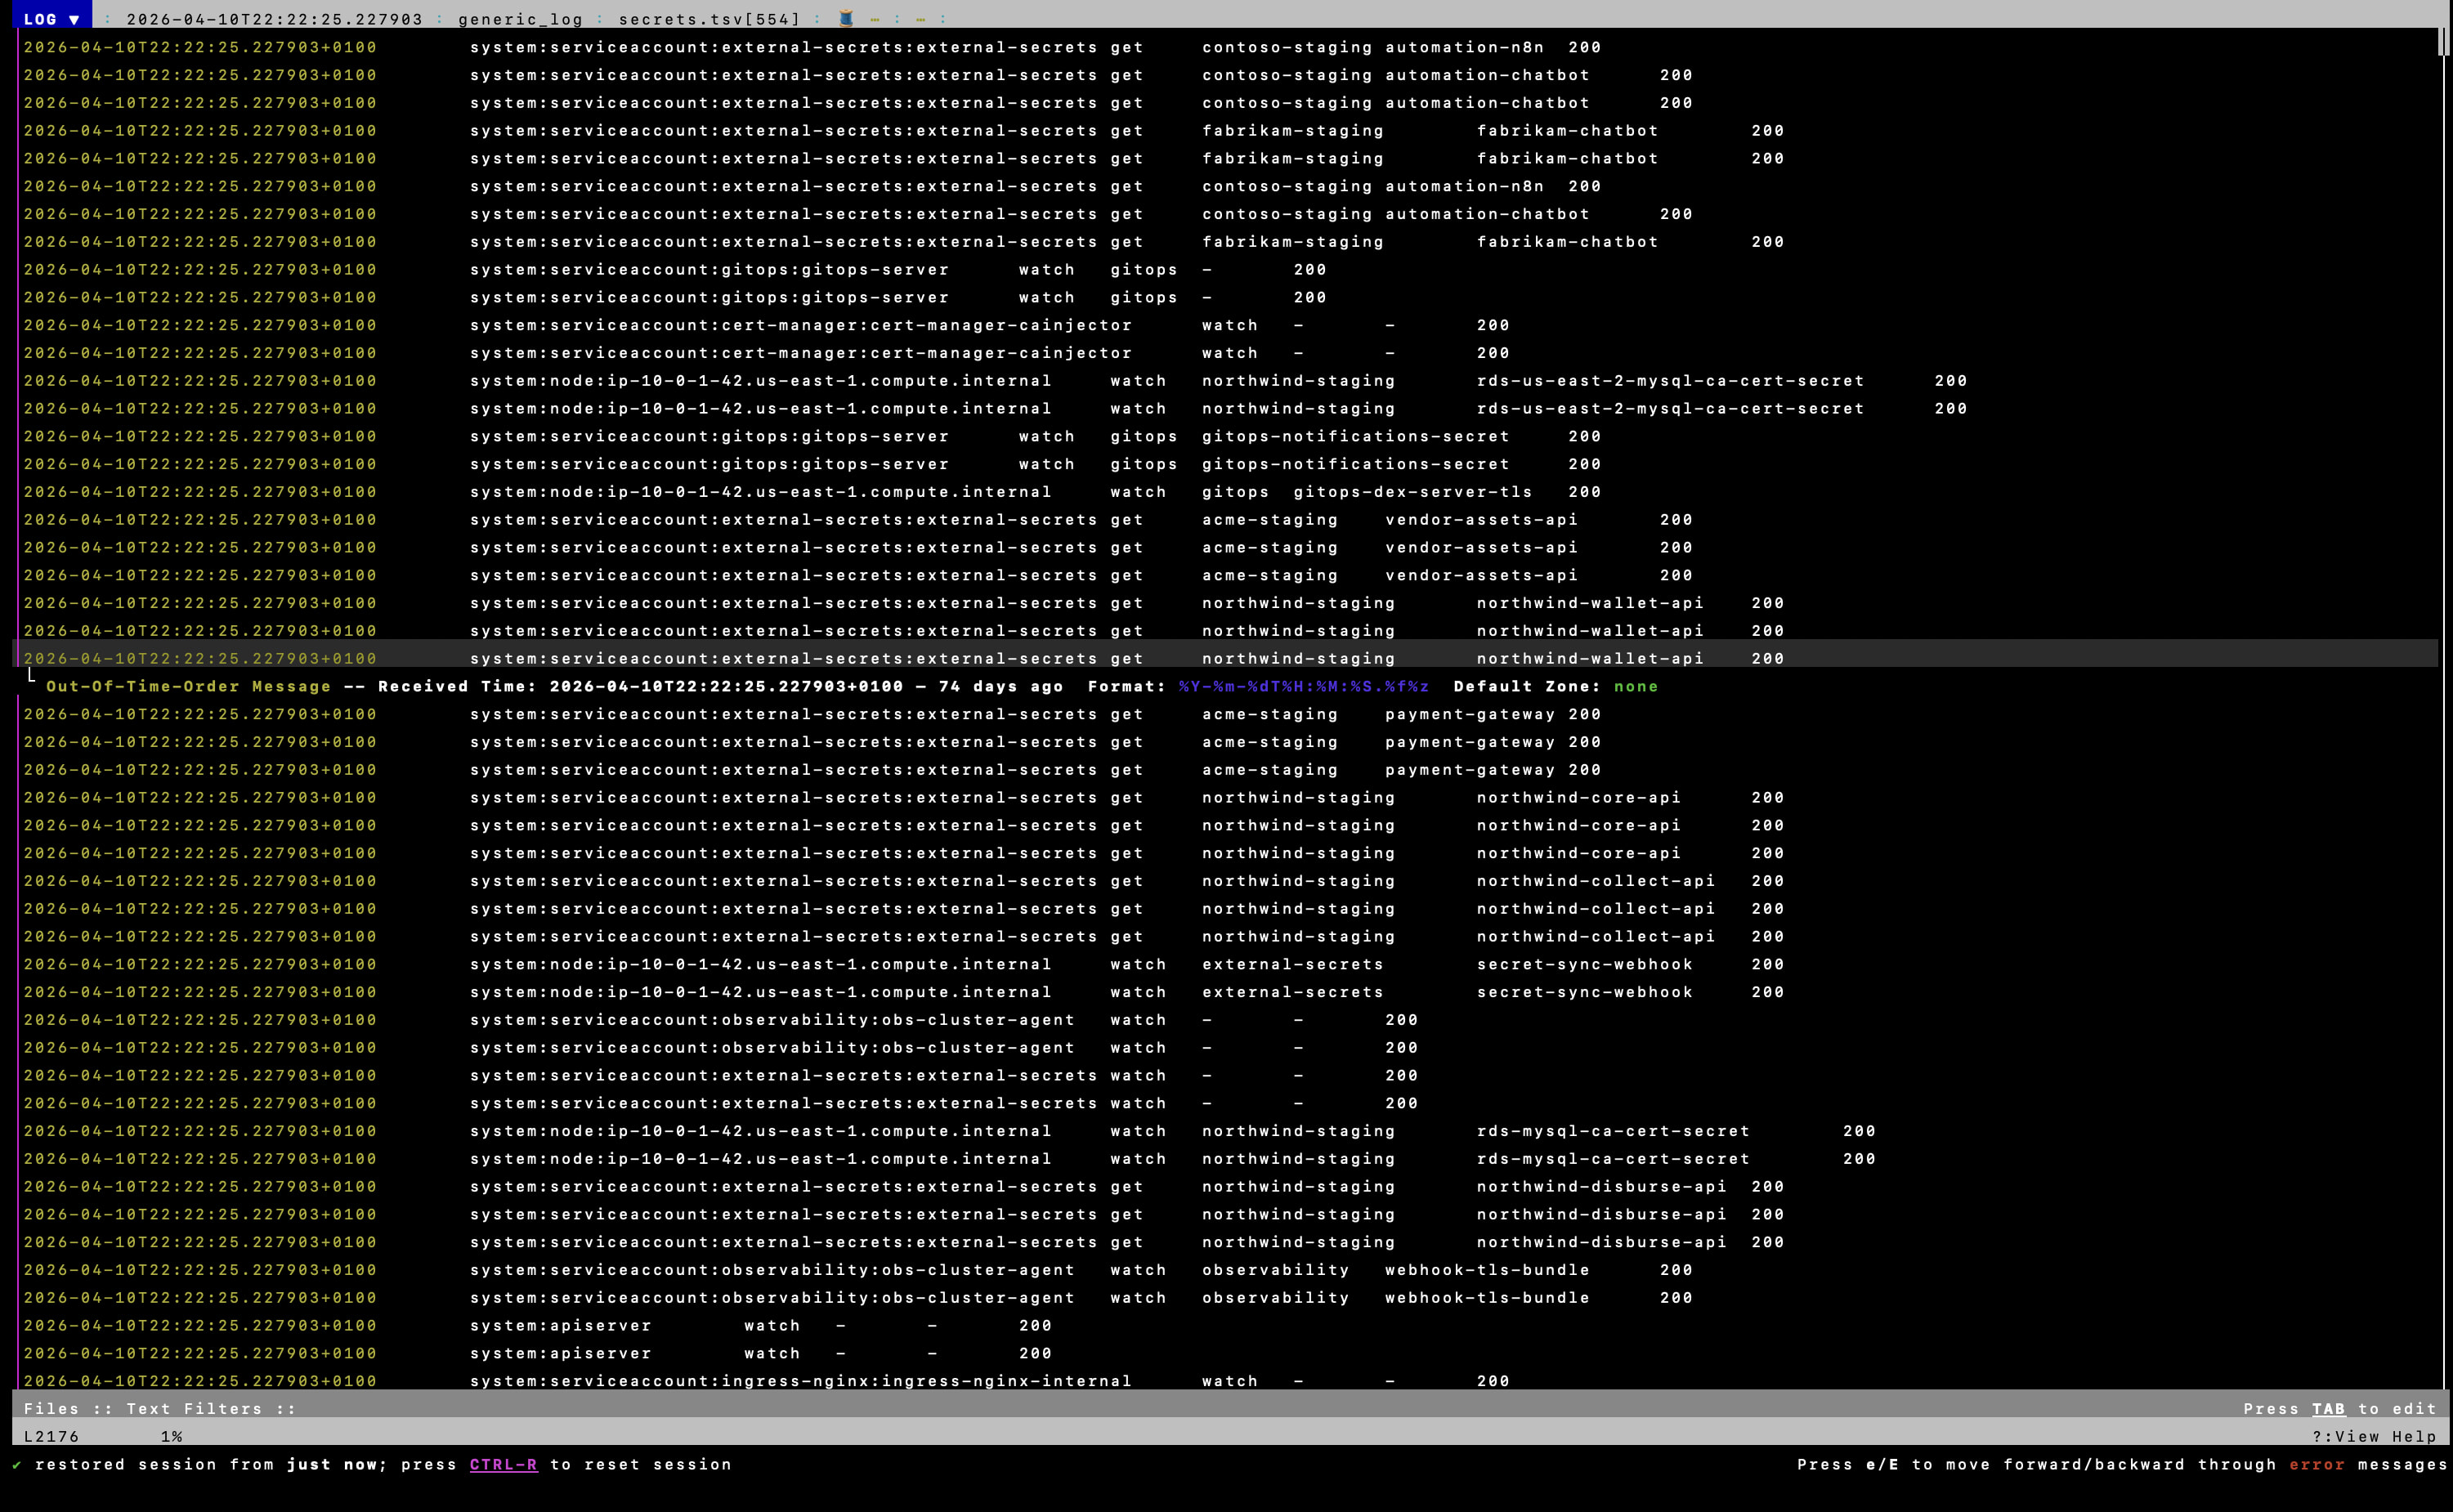
TSV slices in lnav: one timeline across exec, secrets, denials, and human-user activity.
Our threat detection fires to on-call chat at 2pm. Application logs live in our observability stack. Cloud audit trail is on. EKS audit logging was already enabled. On paper, that looked like coverage. Malware scanning said everything was fine.
I'm not going to name every product in our stack here. Substitute yours. The gaps I hit are the point, not the vendor logos.
The gap was workflow, not logging. Ad-hoc jq against the exported audit logs made me miss exec patterns, denied RBAC, and secrets enumeration that were sitting in the data. CloudWatch S3 exports prepend a timestamp to every line, and at 243k lines per shard that is not something you pivot through by hand.
I wrote a sweep script: strip the prefix, extract the fields I care about into TSV, open in lnav. That is when the audit trail started clicking. Your regex muscle from appsec or pentest days comes back fast in lnav. A lot of this work is /exec, :filter-in forbid, and knowing what to grep for before you write the next query.
That gap, between "logging is on" and "I can investigate under pressure", is what this post is about. The guide bits are what every team should have. The messy bits are what I actually had, what I didn't, and what I had to build to catch up.
tl;dr
- Turn on all control plane logging before an incident. Containers are ephemeral, unshipped logs vanish on restart.
- Having logs somewhere is not the same as being able to use them. At export volume, ad-hoc
jqon raw CloudWatch lines made me miss things. A repeatable TSV sweep +lnavfixed that. - Audit logs alone don't close an investigation, even when app logs, cloud audit trail, and threat detection are already in the stack. We had no VPC Flow Logs. That was a hole.
- Don't delete compromised pods first. Quarantine, preserve evidence, rotate credentials, redeploy clean.
Understanding Managed Kubernetes
Whether you run EKS, GKE, or AKS, the shape is the same. Kubernetes clusters carry serious management overhead. The cloud provider hosts and manages the control plane so you can focus on workloads, but the security boundary doesn't move with them.
Every managed cluster splits into two parts:
- Control plane: API server, etcd, controllers. On EKS and peers, the cloud vendor operates this. You don't SSH into it.
- Data plane: worker nodes where your pods actually run. This is yours.
Incident response in Kubernetes is a shared responsibility. AWS (or Google, or Azure) runs the control plane. You run the workloads, and when something goes wrong, you're the one parsing logs at an awkward hour, not the cloud vendor.
One thing that took me a while to internalise: in Kubernetes you can't just kill a compromised pod and walk away. The scheduler recreates it. You need a containment plan before someone on the call reaches for kubectl delete.
What to Log Before You Need It
Not every log source answers the same question. During an IR you are triangulating, no single stream tells the whole story. This is the part people skip when they enable audit logging, pat themselves on the back, and call it a day.
Cluster log sources
| Log source | Purpose | IR relevance |
|---|---|---|
| API server logs | Network calls to the Kubernetes API | Broad kubectl and client interaction |
| Audit logs | Detailed record of individual API events, who did what, from where | Exec into pods, secrets access, RBAC changes, resource creation |
| Authenticator logs | Maps cloud identity to Kubernetes user/group | Leaked cloud credentials used to reach the cluster (EKS authenticator, GKE/AKS equivalents) |
| Controller manager logs | Cluster state changes | Rogue Deployments, deleted namespaces, malicious controllers |
| Scheduler logs | Pod placement decisions | Attacker hiding workloads via taints/tolerations |
| Application logs | stdout/stderr from containers | Exploitation of the app itself, malicious HTTP requests, RCE output |
Cloud and platform log sources
| Log source | Purpose | IR relevance |
|---|---|---|
| Cloud audit trail (CloudTrail, Cloud Audit Logs, Azure Activity Log) | Every cloud API call in the account | Lateral movement from the cluster to other services via the node or workload IAM role |
| VPC / VPC Flow Logs | Metadata about traffic in and out of network interfaces | C2 egress, unusual pod traffic, lateral movement to identity services |
| Threat detection (GuardDuty, Security Command Center, Defender) | Continuous abuse detection | Crypto mining, credential exfiltration, anomalous API patterns |
| Container runtime / node logs | containerd, kubelet, /var/log/pods on the host | Fileless malware, breakout attempts, things audit logs never see |
Audit logs are the spine. They are not the whole skeleton.
What We Had vs What the Guide Says You Need
Every IR write-up lists the same log sources. Here is the honest version for our stack. I am keeping vendor names out of the right column on purpose.
| Log source | The guide says | What we had |
|---|---|---|
| EKS audit logs | Enable all control plane types | On. Exported for offline review. |
| Application logs | Ship stdout to a central platform | On. Exported to our observability stack for the same time window. |
| Cloud audit trail | Account-level API audit | On. |
| Threat detection | Continuous abuse detection + alerts | On. Fires to on-call chat. Malware scan came back clean. |
| VPC Flow Logs | Network metadata for egress/C2 | Not on. This was our gap. |
| Offline audit parsing | Queries you can rerun under pressure | Didn't exist until I wrote the script. |
So no, this isn't a story about a team with zero logging who got paged into chaos. We looked reasonable on a checklist. Threat detection said all good. App logs covered the application layer. Cloud audit trail covered the AWS API side. I still couldn't stitch together a clean picture from audit logs alone. VPC Flow Logs were missing. The offline audit workflow did not exist yet. "Logs exist" and "logs are investigatable" are two different problems.
Audit Logs Alone Won't Save You, Even When Other Logs Exist
The audit trail answers a specific question: who did what in the Kubernetes API, from where. That's valuable. It's not the whole investigation.
| Question | Where I'd look | Could we answer it? |
|---|---|---|
Who ran kubectl exec into this pod? | Audit logs | Not until TSV + lnav |
| What HTTP request hit the app before the shell? | App / observability logs | Yes, we had this |
| Where is this pod sending traffic at 2 AM? | VPC Flow Logs | No, we didn't have them |
| What did the cluster IAM role touch in S3/RDS? | Cloud audit trail | Yes, we had this |
| Is threat detection seeing malware? | On-call alerts | Clean scan, still not a full IR pass |
Audit logs prove API activity. Attackers often touch the app first, your observability stack catches that, then grab a service account token, and then the audit trail lights up. If you can't read audit logs quickly, you miss the API phase even when the other sources are fine.
And a clean malware scan doesn't mean you're done. It means the scanner didn't flag what it knows to look for. It doesn't replace you reading exec events, secret enumeration, and denied RBAC in audit, which I couldn't do efficiently until the script existed.
That's not proper Kubernetes IR. That's a decent stack with a blind spot and a workflow problem.
Log Collection
Control plane logging
On EKS, enable every control plane log type, not just audit:
aws eks update-cluster-config \
  --region region-code \
  --name my-cluster \
  --logging '{"clusterLogging":[{"types":["api","audit","authenticator","controllerManager","scheduler"],"enabled":true}]}'
On GKE, enable control plane logging and audit logging through the cluster logging configuration in GCP. On AKS, enable diagnostic settings and send control plane logs to Log Analytics or storage. The vendor CLI differs; the requirement doesn't: all types, before the incident.
Application logs
Control plane logging doesn't include container stdout. You need a log shipper (Fluent Bit, Fluentd, Vector, whatever fits) forwarding to your observability platform or durable storage. If you aren't shipping application logs centrally, an attacker can cover tracks by crashing the container.
We had this piece. App logs exported into the same investigation window covered execution and app-layer abuse. It did not replace audit log analysis. Different questions, both needed.
kubectl is not your IR platform
kubectl logs reaches the data plane only, pod stdout, events you can still reach. Control plane audit logs live with the provider. Don't conflate "I can kubectl" with "I can investigate."
Pod Forensics: When Logs Aren't Enough
Sometimes the investigation has to leave the API audit trail entirely. The SANS material on EKS forensics and AWS EKS incident response guidance align on the same point: logs get you attribution. They don't replace node-level preservation when the compromise may be fileless or runtime-local.
Fileless malware, in-memory implants, container breakout via a runtime bug, none of that shows up cleanly in kube-apiserver audit JSON. Before you destroy or replace the workload, the playbook should cover:
- Cordon the worker node so nothing new schedules onto it while you collect
- Capture volatile state: OS memory (LiME/Volatility or your org's orchestration tool), netstat/process tree on the node
- Container runtime inspection:
crictl ps,crictl logs, inspect via containerd/CRI-O. On the node,/var/log/podsstill holds pod-level log files the control plane never sees - Snapshot EBS volumes on the worker before isolation changes the picture
- Then quarantine the pod (NetworkPolicy, strip labels), don't
deletefirst
If your IR playbook stops at "run a query in the logging console," you have an API audit checklist, not a Kubernetes IR playbook.
Mapping TTPs to Log Sources
Microsoft's Kubernetes threat matrix maps attacker behaviour to goals. Use it to check whether your logging coverage actually matches the tactics, not just whether audit is on.
| Tactic | Primary log source | What to look for |
|---|---|---|
| Execution | Application logs | Exploitation of the hosted app, webshell traffic |
| Persistence | Audit logs + controller manager | Rogue Deployments, CronJobs, backdoor pods, audit shows who created them |
| Privilege escalation | Audit logs | Create/patch on RoleBindings or ClusterRoleBindings |
| Credential access | Authenticator logs + audit | Service account assuming unexpected cloud roles; secret reads |
| Discovery | Audit logs | High-frequency list/get on secrets, pods, nodes |
| Lateral movement | VPC Flow Logs + cloud audit trail | Traffic to identity/metadata services; cross-service API calls |
| Collection | Cloud audit trail | Unauthorized image pulls from container registry |
| Impact | Threat detection / app metrics | Mining CPU spikes, outbound traffic to known pools, data exfil |
Two audit annotations worth knowing cold, called out in AWS and SANS EKS IR write-ups: authorization.k8s.io/decision (allow/forbid) and authorization.k8s.io/reason (which RBAC rule fired). My denied.tsv slice is built around the first. The second tells you why something was allowed when that matters.
Notice how many rows aren't audit logs. That's the point.
Containment and Eradication
Write this section before someone on the call says kubectl delete pod.
Powering off or deleting a compromised pod destroys volatile evidence, temp files, open connections, in-memory artefacts. And if a Deployment owns that pod, it comes back. Possibly with the same compromise baked into the image.
Recommended sequence:
- Quarantine, don't kill: apply a deny-all NetworkPolicy to the suspect pod. Cuts C2, keeps the container alive for investigation.
- Stop production traffic: remove labels so the load balancer or Ingress stops routing to it.
- Preserve evidence: snapshot logs to durable storage before containment changes what gets recorded.
- Rotate credentials: service account tokens, cloud access keys, anything the actor touched.
- Replace, don't clean: patch the vulnerability, build a new image, deploy fresh. Treat containers like cattle, not pets. Don't scrub a compromised container and call it done.
My Audit Log Workflow (EKS, Exported Offline)
This is the offline pass I run when the log volume is too large for interactive console queries, or when I want rerunnable slices on disk. AWS's own EKS detective guidance notes that as audit volume grows, parsing in the console alone stops scaling. Export, normalize, slice. That matched what I saw.
Export layout
CloudWatch S3 exports land as nested folders per log stream, numbered shards, no file extension. One audit shard in our pull was 243,721 lines.
Each line is <cloudwatch-timestamp> <audit event json>. Standard Kubernetes audit schema on the JSON side: verb, user.username, sourceIPs, objectRef, requestReceivedTimestamp, annotations.authorization.k8s.io/decision. The export format is the wrinkle, not the schema. CloudWatch prepends the ingestion timestamp, so anything that expects bare NDJSON needs a strip step first:
sed 's/^[^ ]* //' "$f"
Why TSV, not raw jq or raw lnav
The events were in the export. I was still missing exec patterns, denied RBAC, and secrets enumeration because the workflow did not scale:
- Ad-hoc
jqacross shards: fine for a one-off question, useless when the question keeps changing under pressure lnavon the raw export: picks up the CloudWatch timestamp as syslog-style, good for regex eyeballing (/exec,:filter-in forbid), no structured pivot onuser.usernameorobjectRef.resourcewhile the body is still JSON on each line- TSV slices per hypothesis (exec, secrets, denied, deletes): flat columns, one row per event, same fields every time. That is what
lnavis built for
So I wrote a sweep script that walks every audit shard, strips the prefix, runs jq once per IR question, and writes TSV. jq does extraction. lnav does navigation. Different jobs.
The script: kube-audit.sh
#!/usr/bin/env bash

LOGS_DIR="${1:?usage: kube-audit.sh LOGS_DIR OUT_DIR}"
OUT_DIR="${2:?usage: kube-audit.sh LOGS_DIR OUT_DIR}"

mkdir -p "$OUT_DIR"

parse() {
  find "$LOGS_DIR" -type f | grep "/kube-apiserver-audit-" | grep -v DS_Store | while read -r f; do
    sed 's/^[^ ]* //' "$f"
  done
}

echo "scanning $LOGS_DIR ..."

echo "extracting denied requests ..."
parse | jq -r '
  select(.annotations["authorization.k8s.io/decision"] == "forbid") |
  [.requestReceivedTimestamp, .user.username, .verb, (.objectRef.resource // "-"), (.objectRef.namespace // "-"), (.sourceIPs[0] // "-"), .requestURI] | @tsv
' > "$OUT_DIR/denied.tsv"

echo "extracting anonymous requests ..."
parse | jq -r '
  select(.user.username == "system:anonymous") |
  [.requestReceivedTimestamp, (.sourceIPs[0] // "-"), .verb, .requestURI] | @tsv
' > "$OUT_DIR/anonymous.tsv"

echo "extracting secrets access ..."
parse | jq -r '
  select(.objectRef.resource == "secrets") |
  [.requestReceivedTimestamp, .user.username, .verb, (.objectRef.namespace // "-"), (.objectRef.name // "-"), (.responseStatus.code | tostring)] | @tsv
' > "$OUT_DIR/secrets.tsv"

echo "extracting exec-into-pod events ..."
parse | jq -r '
  select(.requestURI | test("/exec|/attach")) |
  [.requestReceivedTimestamp, .user.username, (.objectRef.namespace // "-"), (.objectRef.name // "-"), (.sourceIPs[0] // "-")] | @tsv
' > "$OUT_DIR/exec.tsv"

echo "extracting non-system user activity ..."
parse | jq -r '
  select(
    .user.username != null and
    (.user.username | startswith("system:") | not) and
    (.user.username | startswith("eks:") | not)
  ) |
  [.requestReceivedTimestamp, .user.username, .verb, (.objectRef.resource // "-"), (.objectRef.namespace // "-"), (.responseStatus.code | tostring)] | @tsv
' > "$OUT_DIR/human-users.tsv"

echo "extracting delete/deletecollection verbs ..."
parse | jq -r '
  select(.verb == "delete" or .verb == "deletecollection") |
  [.requestReceivedTimestamp, .user.username, .verb, (.objectRef.resource // "-"), (.objectRef.namespace // "-"), (.objectRef.name // "-")] | @tsv
' > "$OUT_DIR/deletes.tsv"

echo "extracting non-200 response codes ..."
parse | jq -r '
  select(.responseStatus.code != 200 and .responseStatus.code != 201) |
  [.requestReceivedTimestamp, (.responseStatus.code | tostring), .user.username, .verb, (.objectRef.resource // "-"), .requestURI] | @tsv
' > "$OUT_DIR/errors.tsv"

echo "unique principals summary ..."
parse | jq -r '.user.username' | sort | uniq -c | sort -rn > "$OUT_DIR/principals.txt"

echo ""
echo "results written to $OUT_DIR:"
for f in "$OUT_DIR"/*.tsv "$OUT_DIR"/*.txt; do
  count=$(wc -l < "$f")
  printf "  %-30s %s lines\n" "$(basename $f)" "$count"
done

echo ""
echo "open in lnav:"
echo "  lnav $OUT_DIR/*.tsv"
Run it:
chmod +x kube-audit.sh
./kube-audit.sh /path/to/cloudwatch-export /path/to/results
lnav /path/to/results/*.tsv
| Output file | What it hunts |
|---|---|
denied.tsv | RBAC denials, privilege probing |
anonymous.tsv | Unauthenticated API calls |
secrets.tsv | Secret reads, lists, writes, check 403 vs 200 |
exec.tsv | kubectl exec / attach, correlate IP and user against change windows |
human-users.tsv | Non-system principals (filters system:* and cloud-specific noise) |
deletes.tsv | Resource destruction, possible cover-up |
errors.tsv | Failed abuse attempts |
principals.txt | Who's in this cluster, by volume, start triage here |
This script is chapter one of the playbook, not the whole book.
lnav on the TSV output
Open the slices together so timestamps line up across hypotheses:
lnav exec.tsv secrets.tsv denied.tsv human-users.tsv
TSV slices in lnav: one timeline across exec, secrets, denials, and human-user activity.
Commands I actually use once the TSV files exist. This is where regex habits pay off:
| Goal | lnav command |
|---|---|
| Search all open files for exec URIs | /\/exec then n/N |
| Keep only RBAC denials | :filter-in forbid on denied.tsv |
| Drop system noise | :filter-out system: |
| Focus one IAM role | :filter-in arn:aws:iam:: or :filter-in dev-role |
| Focus one namespace | :filter-in production |
| Jump to incident window | :goto 2026-04-10T14:00:00 |
| Mark a line, return later | m on line, then :goto #mark |
| SQL on TSV columns (exec file) | ;SELECT * FROM exec WHERE c2 LIKE '%namespace-you-care-about%' |
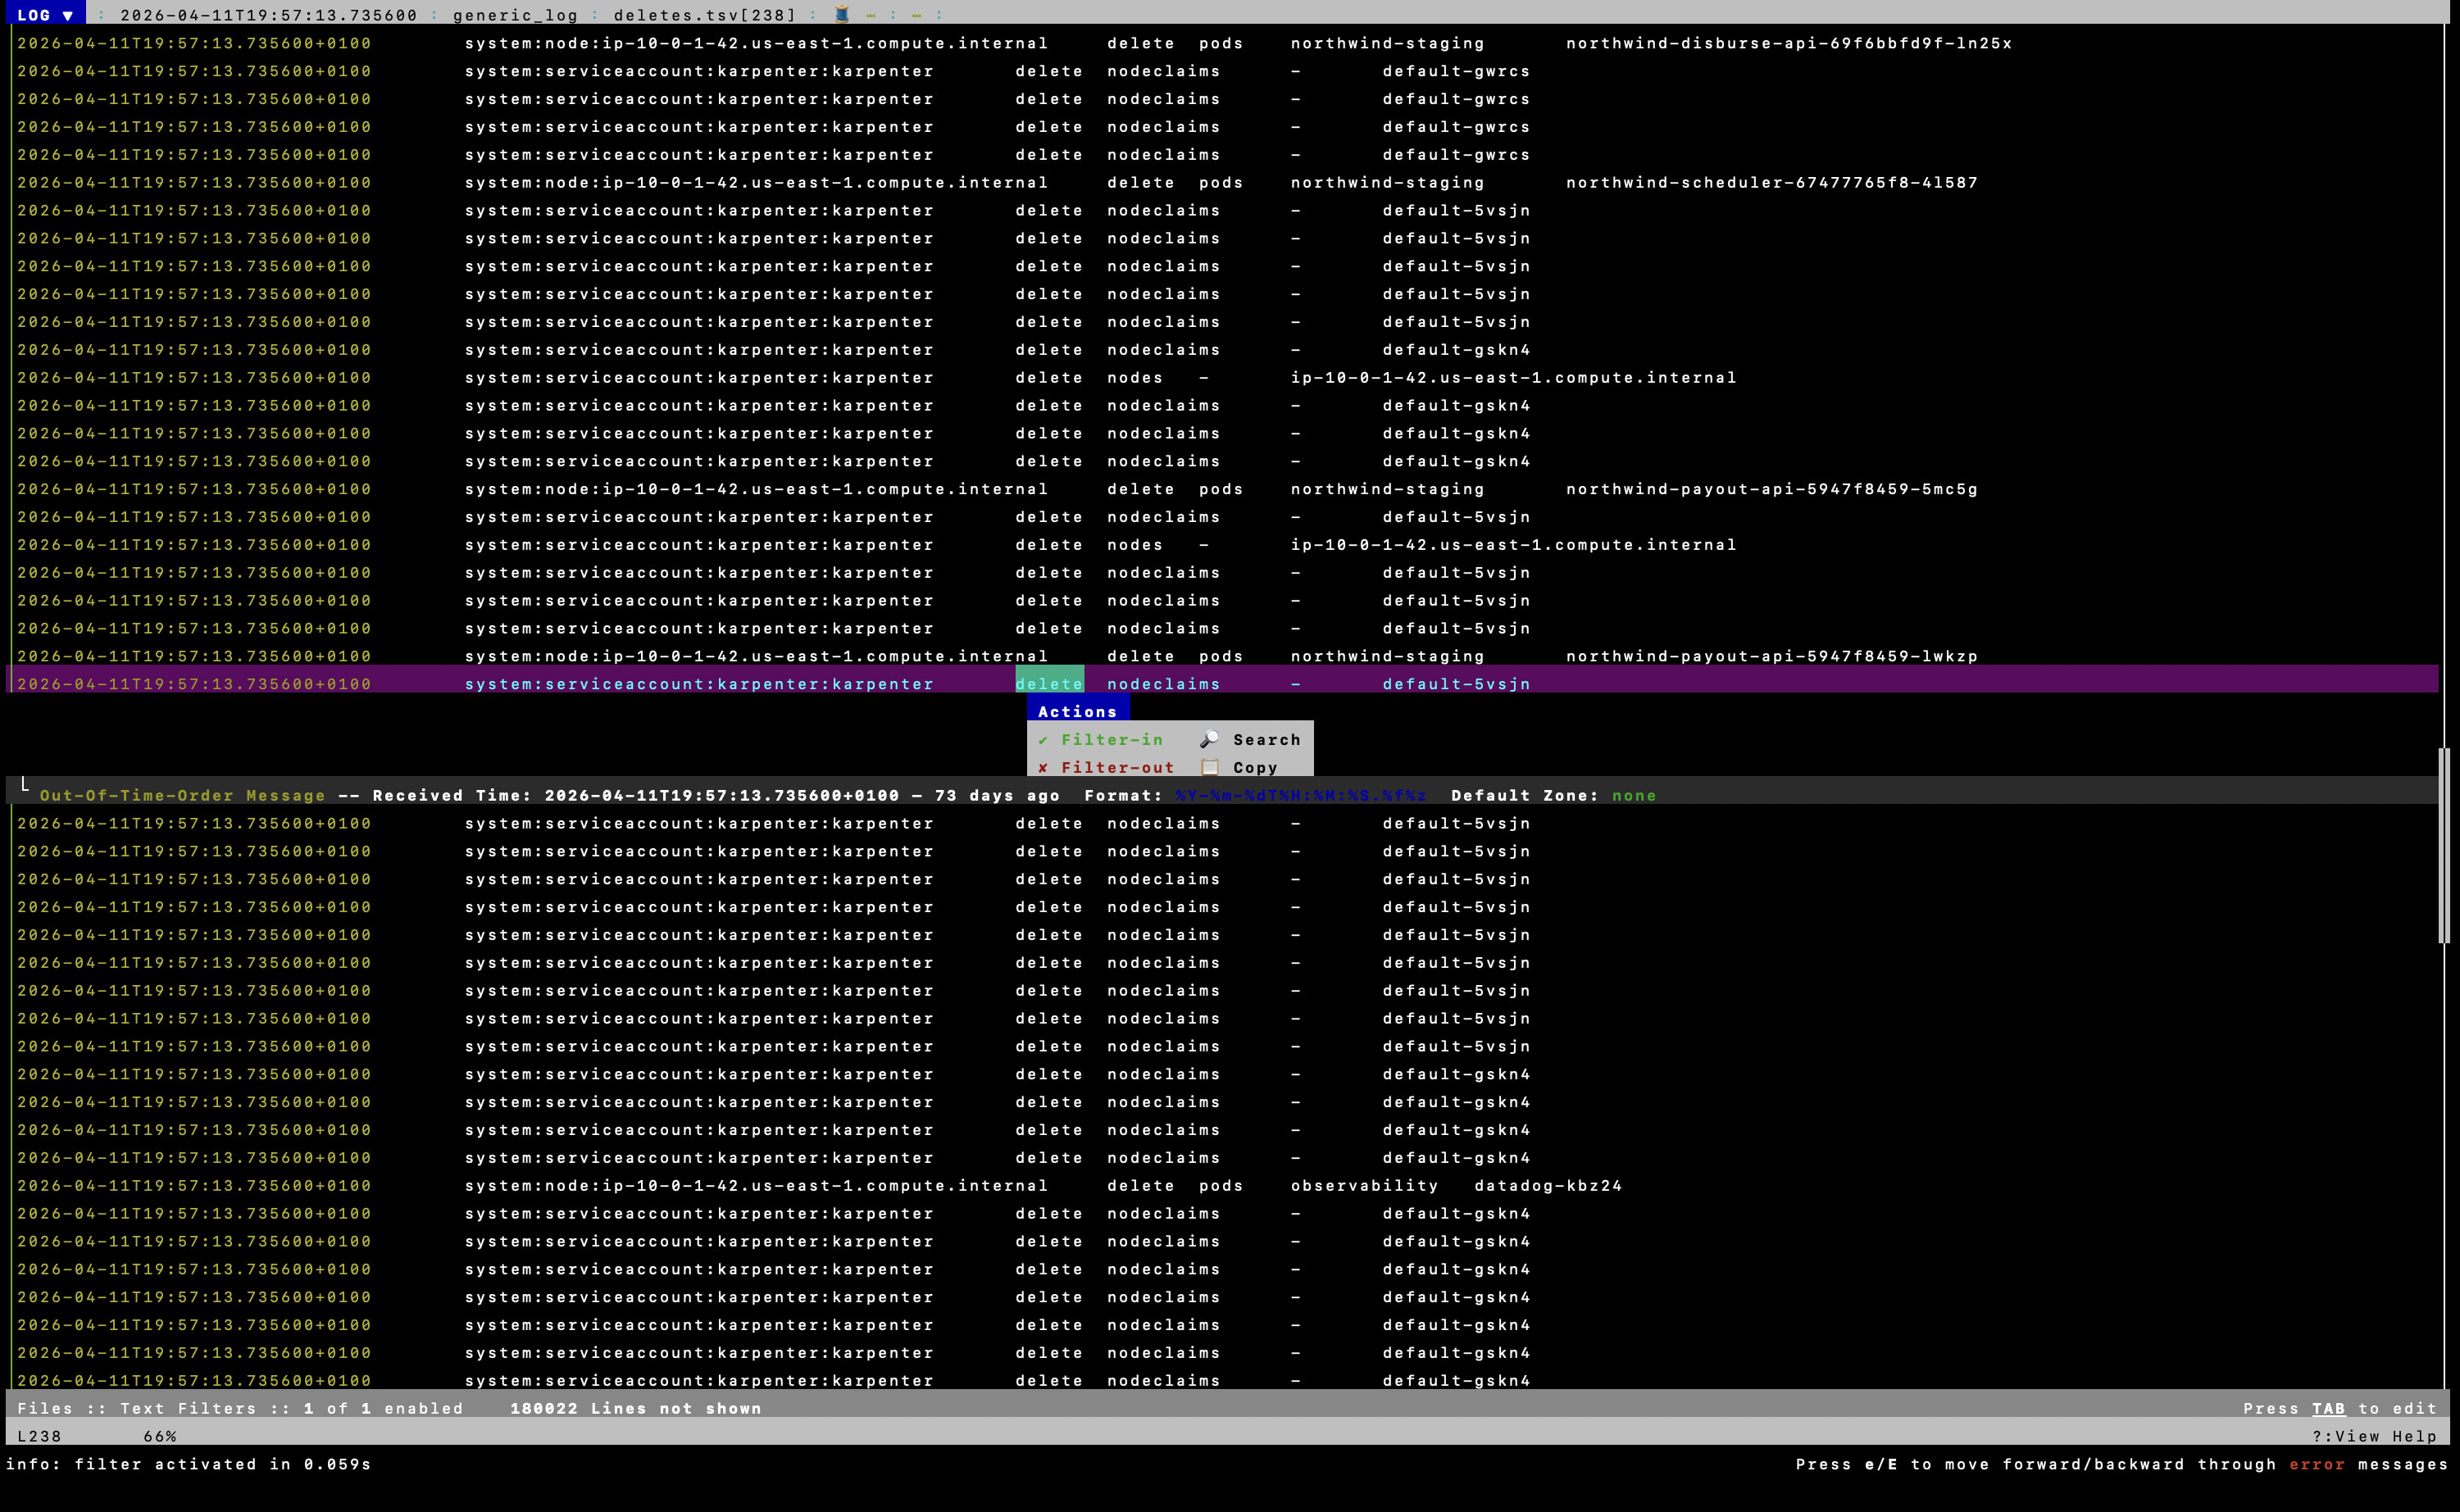
:filter-in on a TSV slice, same idea as :filter-in forbid on denied.tsv or :filter-in on a namespace.
exec.tsv columns from the script: timestamp, user, namespace, pod, sourceIP. Adjust the ;SELECT column names to what lnav shows on your build (:schema lists them).
On the raw export before TSV, lnav still helps for quick regex passes (/attach, :filter-in "system:anonymous"). Structured pivots across exec + secrets + denials at once is what the TSV step is for.
Workflow:
- Alert in on-call chat
- Run
kube-audit.shon the exported audit logs principals.txtfirst, then TSV slices inlnav- App logs in observability for the same time window
- Cloud audit trail if the cluster IAM role or AWS APIs are in scope
- Acknowledge the VPC Flow Logs gap for pod egress
Real-World Context
In mid-2025, the North Korean state-sponsored group TraderTraitor hit a cryptocurrency exchange where a Kubernetes cluster became the pivot into other services. Initial access came through phishing, not a fancy API exploit. The actor deployed a malicious pod designed to expose a mounted service account token, authenticated to the Kubernetes API, ran discovery, backdoored a production pod for persistence, and moved laterally into cloud services until they reached financial systems.
Audit logs would show the API-phase, token abuse, discovery calls, backdoor resource creation, if you can actually read them. App logs would show the exploitation phase. Cloud audit trail would show lateral AWS API use. Flow logs would show egress. No single source covers it.
Kubernetes is a pivot point. Log the cluster. Log around it. And make sure you can investigate what you've logged.
What Our Playbook Looks Like Now
Version one was "alert in chat, check app logs, grep audit in the console." That wasn't enough. I was missing audit patterns until the TSV script, and we had no network-layer visibility at all.
| Phase | Guide (what every team should do) | Our stack today |
|---|---|---|
| Prepare | All control plane logs. App logs shipped. Flow logs on. Cloud audit trail on. Threat detection. Offline audit script tested. | Audit + app logs + cloud audit trail + alerts on. VPC Flow Logs off. kube-audit.sh built. |
| Detect | Threat detection + anomaly rules on audit patterns | On-call alert. Clean scan ≠ done. |
| Triage | Audit slices + app logs + flow + cloud audit trail | kube-audit.sh → lnav → observability → cloud audit trail. Flow gap acknowledged. |
| Contain | Cordon node if needed. NetworkPolicy quarantine. Strip labels. Snapshot volumes/logs | Written into playbook, don't delete pod first |
| Eradicate | Rotate creds. Patch. New image. Redeploy | Cattle not pets |
| Learn | Tabletop with exported log folders | Still on the list |
Still on the list for us: turn on VPC Flow Logs, authenticator parsing in the same script, automated audit export when an alert fires.
Incident Response Checklist
Use this as a completion criterion for the investigation:
- All control plane log types are enabled (api, audit, authenticator, controllerManager, scheduler)
- Application logs are shipped to a central platform with the same time window
- Cloud audit trail is enabled and queryable
- Threat detection alerts are in the on-call channel
- VPC Flow Logs are enabled (acknowledge if still off)
- Audit logs are exported offline and
kube-audit.shhas been run -
principals.txtreviewed for unexpected or high-volume users -
lnavis open on the relevant TSV slices (exec, secrets, denied, human-users) - App logs in observability are checked for the same incident window
- Cloud audit trail is checked for cluster IAM role or cloud API activity
- Compromised pod is quarantined (NetworkPolicy), not deleted first
- Worker node is cordoned and volatile state captured if needed
- Credentials rotated before containment changes are finalized
- New image built and workload redeployed after patching
- Lessons are captured in a tabletop or post-incident review
Conclusion
Building a Kubernetes IR playbook isn't a PDF exercise. It's knowing which log source answers which question, and being honest about the ones you skipped and the workflows that don't work yet.
We weren't flying blind. Alerts, app logs, cloud audit trail, EKS audit logging enabled. Malware scanning said all good. I still missed audit patterns until I built the TSV sweep and ran it through lnav. VPC Flow Logs remain the gap for pod egress.
If you're writing your playbook: log what the guide says, then test the offline workflow before you need it. Green toggles in the console are not the same as an investigation that holds up.
The best time to enable logging was yesterday. The second best time is before an alert fires and you discover your export pipeline and your tooling are not aligned.
Further Reading
- SANS, EKS digital forensics and IR (PDF)
- AWS EKS, incident response and forensics best practices
- AWS EKS, auditing and logging best practices
- Microsoft Kubernetes Threat Matrix
- TraderTraitor / North Korean targeting of K8s environments