The Incident Response Step Most Teams Skip: Memory Forensics for Kubernetes

Your audit logs are quiet. Falco did not fire. The pod filesystem looks clean. And the threat actor is still in the cluster.
That is the gap memory forensics exists to close. Disk and API logs answer what touched the control plane. RAM answers what was running when you froze the box, including the process that never wrote a file, the shellcode sitting in a hollowed Go binary, and the cloud token that only existed as a string in process memory.
I already wrote about why audit logs alone will not save you and about runtime detection with Falco. This post is the next layer most Kubernetes IR playbooks still leave blank: capture memory, then ask Volatility what was actually there.
What I am proving (and what I am not)
I am not proving that Kubernetes is broken, or that I found a mysterious missing CVE.
I am proving that runtime evidence that never landed on disk (and is not in kubectl logs) can still be recovered from host memory, and that a controlled capture + analysis path finds it.
Attackers and post-exploitation tooling often leave that class of artifact on purpose: API keys, session tokens, malware config, C2 URLs, injected commands. Those strings live in process memory. They may never hit a logfile or the container rootfs the way people expect. When the pod dies, they are gone unless you already imaged RAM.
For the lab I do not run real malware. I plant a controlled stand-in: a known marker string held in a disposable pod's process memory (env + cmdline), using a boring busybox image. Then I capture node memory, map host PID to container, and show strings / Volatility recovering that exact marker. Plant known evidence → capture → prove the tools find it. That planted string is the thing "detected."
Exact lab artifact:
| Item | Value |
|---|---|
| Image | public.ecr.aws/docker/library/busybox:1.36 |
| Env | IR_MEM_LAB_MARKER=MEMFORENSICS_LAB_MARKER_20260831 |
| Cmdline | sh -c echo MEMFORENSICS_LAB_MARKER_20260831; sleep 3600 |
| Found with | strings memory.lime | grep -F MEMFORENSICS_LAB_MARKER_20260831 (also grep -a on the LiME) |
tl;dr
- Containers are ephemeral. A killed pod may delete the only copy of what you needed.
- On managed Kubernetes with real worker VMs, capture node memory with AVML, then analyze with Volatility 3. Serverless node models are a different problem.
- Volatility will not magically "see pods." You get Linux processes, nets, and injected regions. You map those back to containers yourself with
crictl/ cgroup / namespace context you captured at the same time. - Practice on a lab node before you need this at 2am. Symbol tables (ISF) for your node kernel are the friction point, not the CLI.
Why Memory Matters More in Kubernetes
On a traditional VM, "image the disk, then image memory" is standard DFIR. On Kubernetes, three things make memory the higher-value artifact:
- No durable disk for the workload. The container rootfs dies with the pod. Fileless loaders and in-memory backdoors leave nothing for
kubectl cpor a volume snapshot. - Threat actors know that. Post-exploitation that stays in RAM is a rational choice against teams whose IR stops at cloud logs and image scans.
- Your detection stack is syscall- and API-biased. Falco sees
execve. Audit logs see API calls. Neither reconstructs the full process tree and open sockets at a frozen point in time the way a memory image does.
Memory is not a replacement for those controls. It is what you reach for when they are silent and you still have a live, suspicious node.
Capture Before You Contain (Order Matters)
Same rule as the IR playbook: quarantine, do not delete.
1. Isolate network (NetworkPolicy / security group), keep the process alive
2. Cordon the node, stop new pods landing on the evidence host
3. Capture volatile state (memory + runtime inventory)
4. Then rotate credentials and rebuild
If someone on the bridge says "just delete the Deployment," that is when you lose the dump.
Same trap one level up: if the node is already killed, this path is dead. I need a live, still-running worker to acquire RAM. Once the instance is gone, that memory is gone unless I already have a dump (or some rare crash/hibernation leftover). Disk snapshots do not include process RAM. Capture while the node is still up, or I do not get this kind of forensics later.
Also decide what you are imaging:
| Target | What you get | When to use it |
|---|---|---|
| Worker node RAM (AVML) | Full host memory: kubelet, containerd, every container's pages | Default on VM-backed workers |
Per-process dump (gcore / varc) | Smaller, faster, scoped to PIDs you already care about | When you know the bad PID and full RAM is too large / too slow |
| Sidecar with shared PID ns | Access to target pod processes without full node SSH | Restricted environments; still needs privilege |
Fargate-style and other serverless node models do not give you a host to dump. Plan process-level collection and cloud-provider IR paths separately. Do not pretend AVML works there.
The Lab Path (Plant → Capture → Prove)
I ran this on a shared preprod managed cluster (cordon only, no drain, disposable namespace, wipe when done). Screenshots below are scrubbed: no node IPs, no cluster names, no version strings that fingerprint the control plane or AMI.
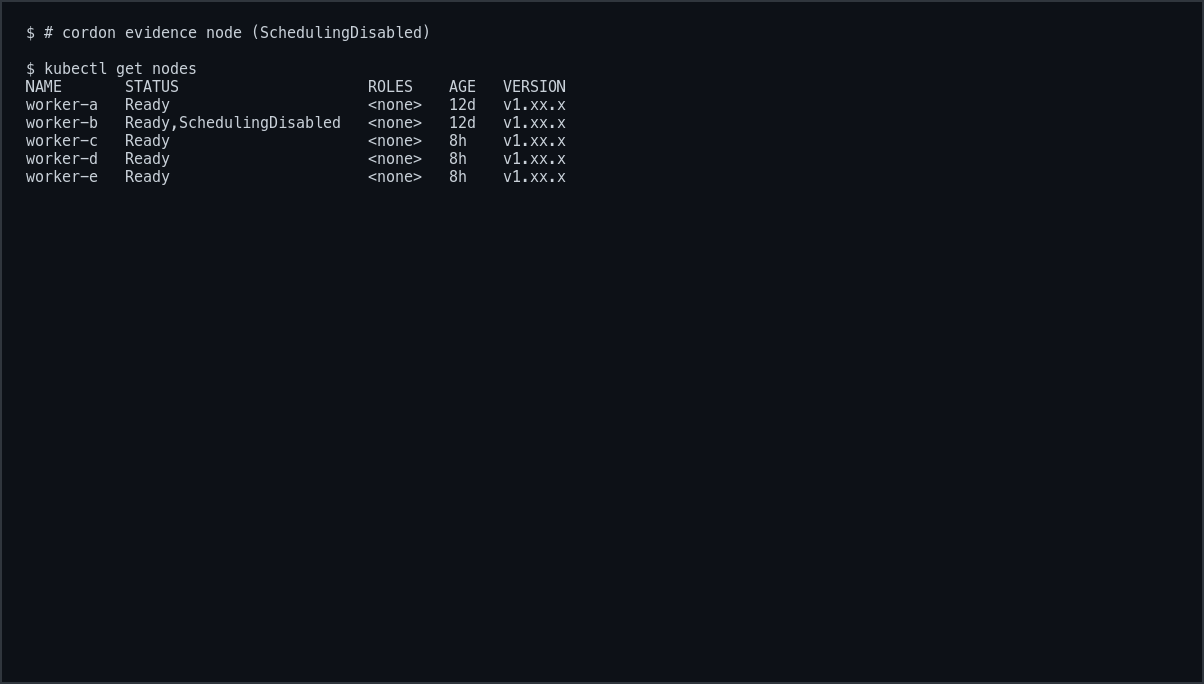
1. Cordon the evidence node
kubectl cordon <evidence-node>
kubectl get nodes
# one node shows Ready,SchedulingDisabled
2. Disposable lab pod with a planted marker
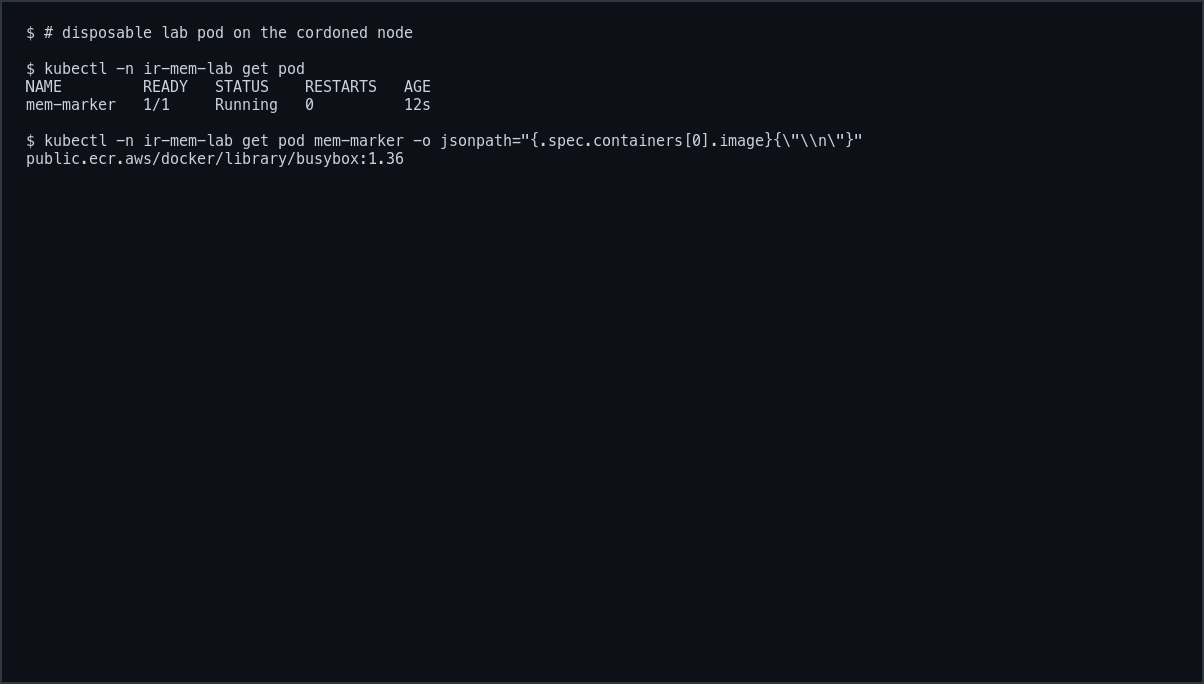
Same image the guide already uses. Marker in env and cmdline so it is unambiguously in process memory:
kubectl create namespace ir-mem-lab

cat <<'EOF' | kubectl apply -f -
apiVersion: v1
kind: Pod
metadata:
  name: mem-marker
  namespace: ir-mem-lab
spec:
  nodeName: <evidence-node>
  restartPolicy: Never
  containers:
  - name: lab
    image: public.ecr.aws/docker/library/busybox:1.36
    env:
    - name: IR_MEM_LAB_MARKER
      value: "MEMFORENSICS_LAB_MARKER_20260831"
    command: ["sh", "-c", "echo MEMFORENSICS_LAB_MARKER_20260831; sleep 3600"]
EOF

kubectl -n ir-mem-lab get pod
Prove it is live in the process before you image anything:
kubectl -n ir-mem-lab exec mem-marker -- sh -c 'printenv IR_MEM_LAB_MARKER; ps w'
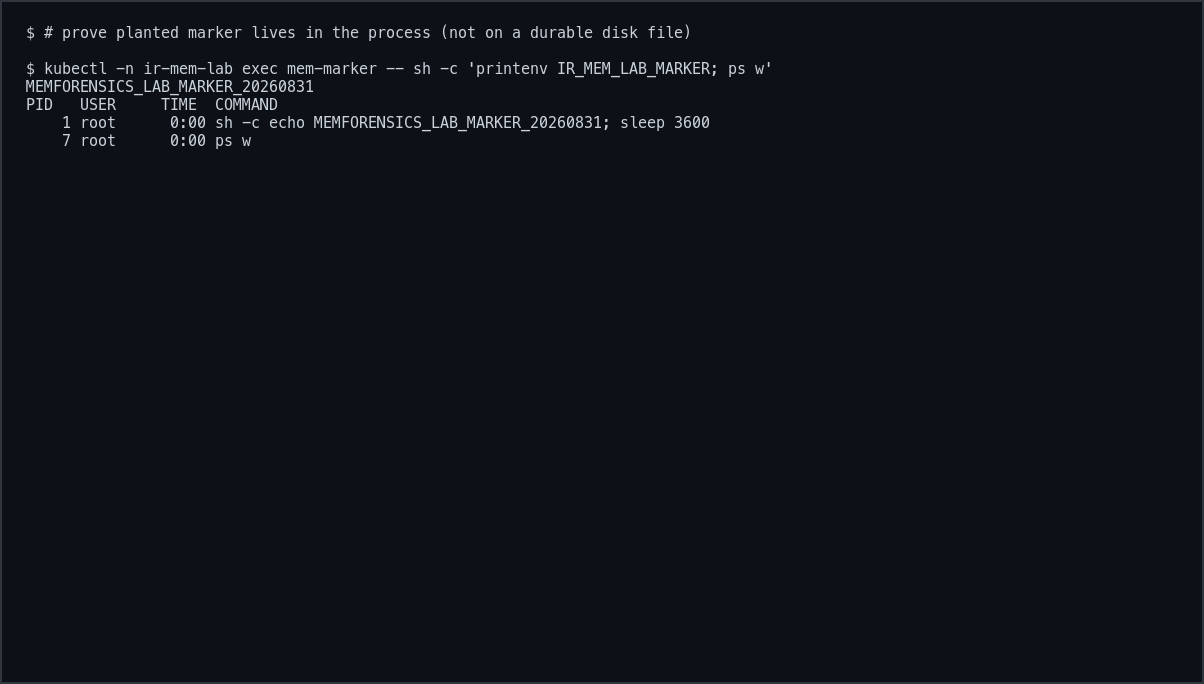
That string is the stand-in for "attacker secret only in RAM." Cleanup later is just delete the namespace and wipe dumps. No special image teardown.
3. Capture node memory with AVML
AVML (Acquire Volatile Memory for Linux) is the practical choice on modern cloud Linux: userspace binary, no kernel module compile against the running AMI, LiME-format output that Volatility understands.
Get onto the cordoned node with your usual break-glass path (SSM session, or kubectl debug node/<node>).
# on the compromised worker
curl -fsSL -o avml \
  https://github.com/microsoft/avml/releases/download/v0.20.0/avml
chmod +x avml
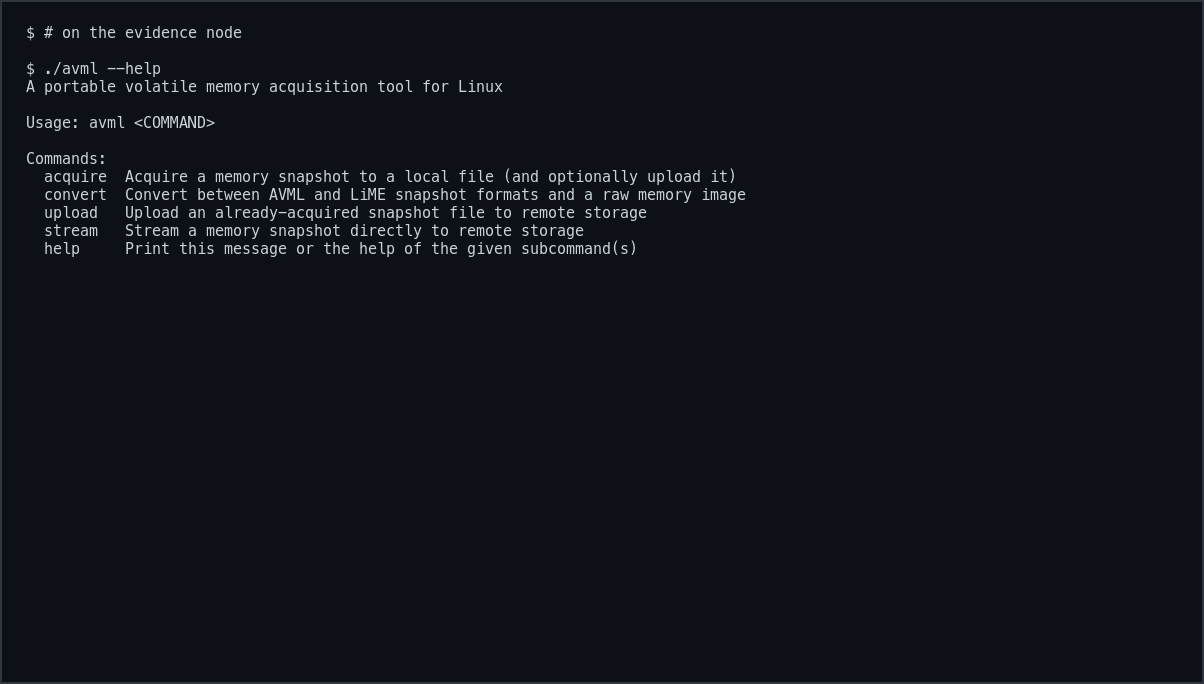
./avml --help
AVML 0.20+ uses subcommands. Bare ./avml outfile.lime fails with "unrecognized subcommand". Use acquire:
# Prefer writing OFF the compromised root disk if you can (extra volume / IR share).
sudo ./avml acquire /var/tmp/ir-case/memory.lime
ls -lh /var/tmp/ir-case/memory.lime
# size should be roughly host RAM
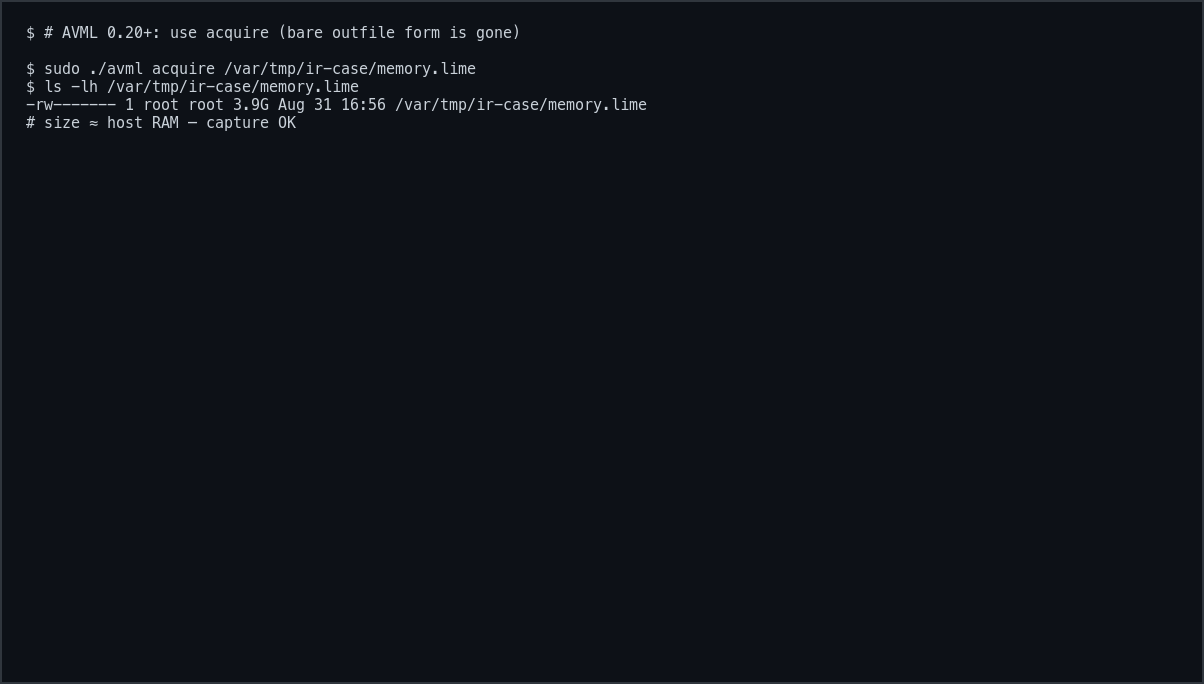
AVML is quiet while it runs. Confirm the file exists and matches RAM size before you tear the node down.
4. Freeze the runtime context (crictl)
Volatility will show host PIDs. You need the map from PID → container → pod.
On many worker AMIs crictl is missing. Install a cri-tools release binary and point it at containerd:
curl -fsSL -o /tmp/crictl.tgz \
  https://github.com/kubernetes-sigs/cri-tools/releases/download/v1.33.0/crictl-v1.33.0-linux-amd64.tar.gz
sudo tar -C /usr/local/bin -xzf /tmp/crictl.tgz crictl

export CONTAINER_RUNTIME_ENDPOINT=unix:///run/containerd/containerd.sock
crictl ps -a > /var/tmp/ir-case/crictl-ps.txt
crictl pods > /var/tmp/ir-case/crictl-pods.txt

CID=$(crictl ps --name lab -q | head -1)
crictl inspect "$CID" | jq '{pid: .info.pid, name: .status.metadata.name}'
pgrep -af MEMFORENSICS_LAB_MARKER_20260831
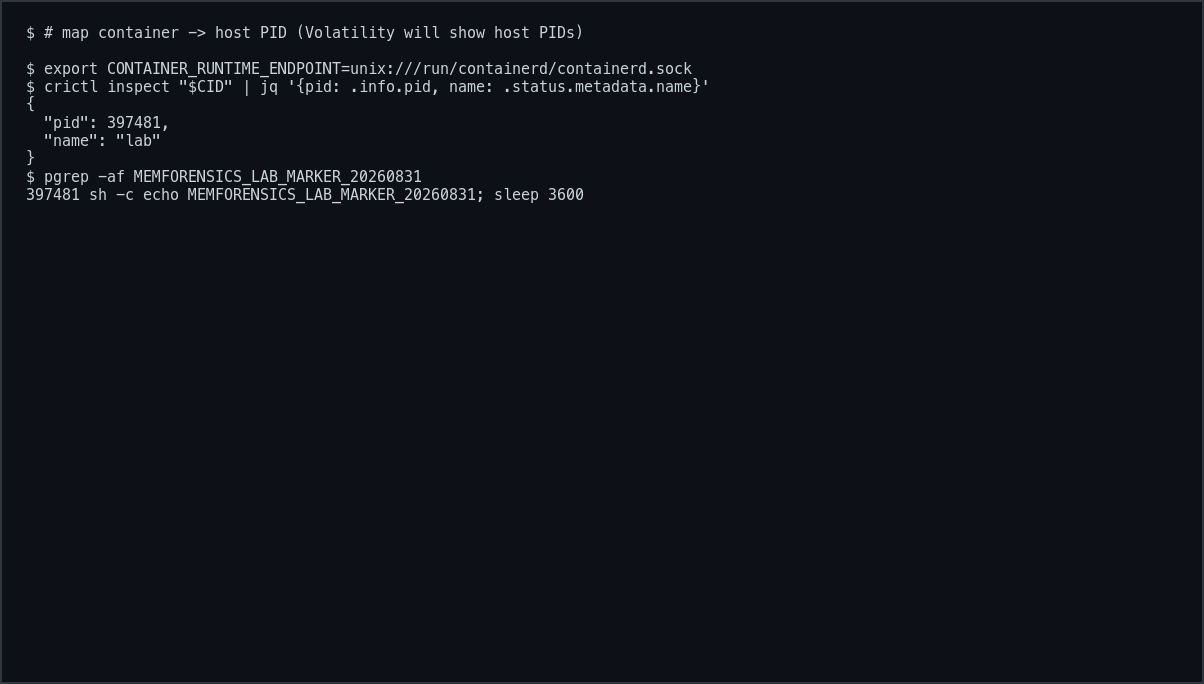
Without that inventory, a Volatility pslist is a phone book with no street names.
5. Ship the dump off the node
A multi-GB kubectl cp over a flaky VPN will time out or leave you with a partial file. I hit that. A short-lived private object (presigned PUT from the node, then pull to the analysis host) was more reliable. Compress first if you can.
gzip -c /var/tmp/ir-case/memory.lime > /var/tmp/ir-case/memory.lime.gz
# upload via short-lived URL or IR role; download on analysis host
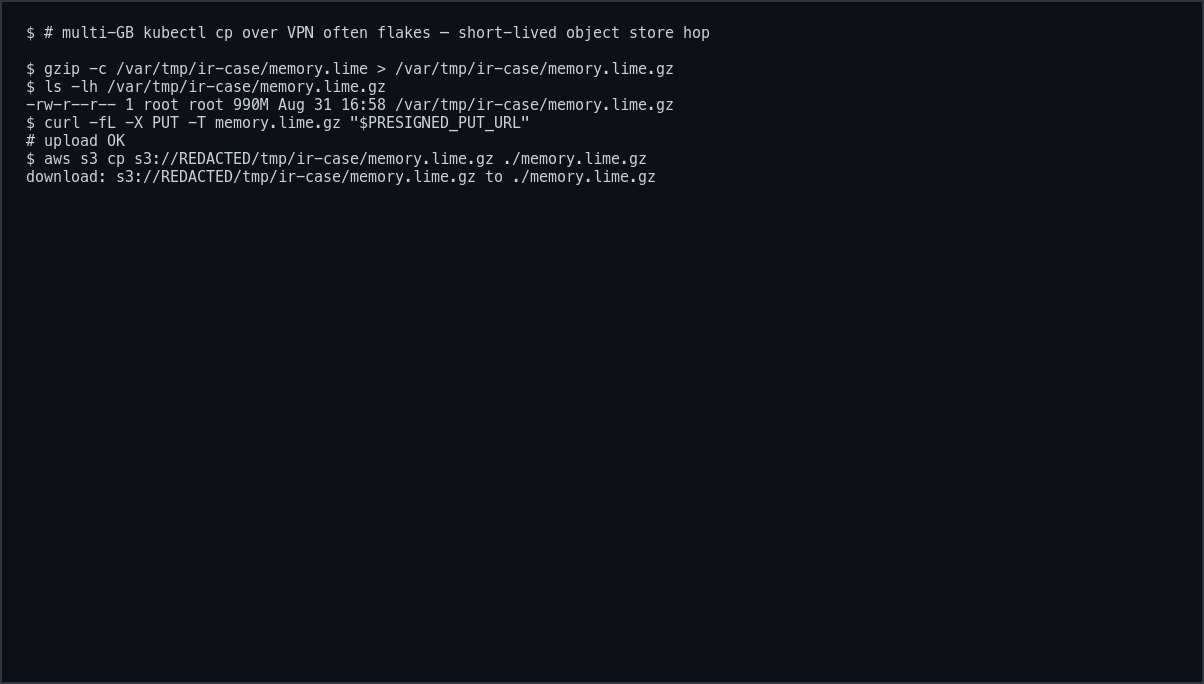
Do not try to run Volatility on a small evidence node that is already full of app pods. Analyze on your laptop or a dedicated forensics host.
Volatility 3: What You Actually Run
Volatility is a Python framework for extracting structured artifacts from a memory image. Volatility 3 uses symbol tables (ISF) instead of the old profile model. Linux still needs the right symbols for your kernel. Budget time for ISF generation against your worker AMI. That is the part people skip in demos and regret in incidents.
pipx install volatility3

# sanity check: usable LiME image (no ISF required)
vol -f memory.lime banners
# On Volatility 3.2.x the plugin is banners (banners.Banners).
# Older docs say linux.banner; that name is gone.
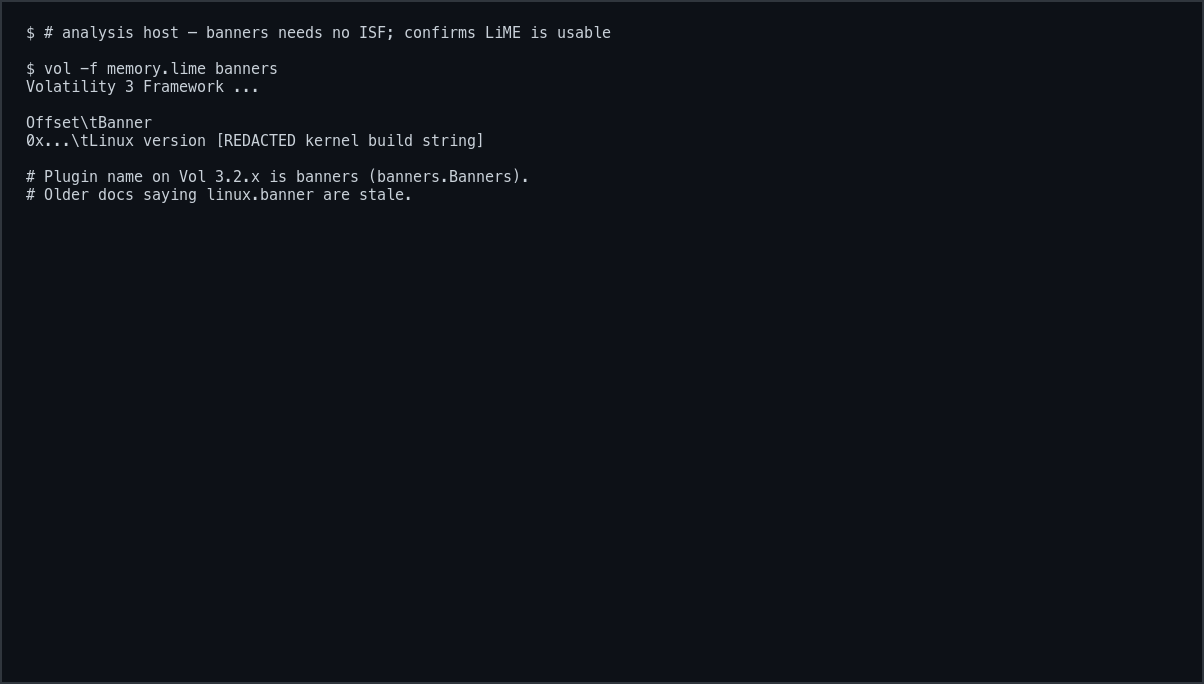
If banners fails, stop and fix the image before you trust deep plugin output. I redact the full kernel build string in screenshots because it fingerprints the AMI; keep the real string in your private case notes.
The detection: recover the planted marker
This is the whole point of the lab. The marker never needed a durable file in the container rootfs. It was in process memory. After AVML, it is in the LiME:
strings memory.lime | grep -F 'MEMFORENSICS_LAB_MARKER_20260831' | head
# also works: grep -a -F -m 5 MEMFORENSICS_LAB_MARKER_20260831 memory.lime
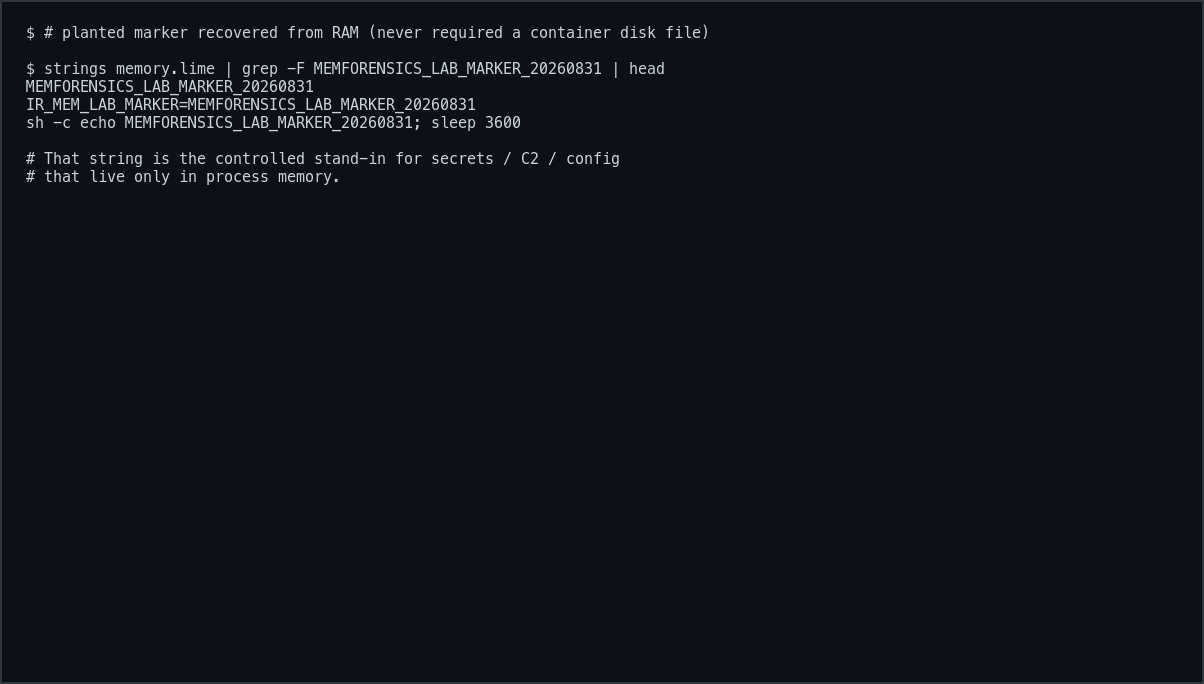
In an incident you would swap the planted string for a known IOC, token prefix, or C2 domain. Same class of hunt.
ISF is a real step
I did not get linux.pslist (or the other deep Linux plugins) working on this dump. Volatility 3 needs an ISF symbol table for the exact worker kernel, and without that it cannot walk the process list for you. The lab still closed on strings / grep -a recovering the planted marker; structured process and injection analysis wait until you generate symbols for your AMI.
Plugins that earn their keep once you have an ISF
vol -f memory.lime linux.pslist
vol -f memory.lime linux.pstree
vol -f memory.lime linux.sockstat
vol -f memory.lime linux.malfind
# string / regex plugins: check `vol --help` (names drift across vol3 releases)
vol -f memory.lime linux.vmaregexscan --help
What you are hunting for, mapped to Kubernetes reality:
| Finding | Why it matters on a node |
|---|---|
Process that is not in your golden image / not a child of containerd-shim as expected | Rogue binary, breakout helper, miner |
malfind hits inside a language runtime or sidecar | Process injection / hollowing |
| Unexpected outbound sockets to raw IPs / odd ports | C2, mining pools, IMDS abuse from a process that already exited |
Correlate suspicious host PIDs back to crictl inspect output. That is how "weird process 397481" becomes "compromised pod mem-marker in ir-mem-lab."
Where This Fits Your Existing Stack
Detect (Falco / cloud detections / audit)
  → Triage (logs, TSV sweep, lnav)
  → Contain (NetworkPolicy, cordon)
  → Preserve (AVML + runtime inventory + disk if needed)
  → Analyze (Volatility 3)
  → Eradicate (rotate, rebuild, redeploy)
Memory forensics is step four, not step one. If you have no detection and no containment plan, a perfect dump still leaves you watching the threat actor move.
For offensive work the inverse also holds: if you know what malfind and sockstat surface, you know how loud your post exploitation tooling is, and you can put that in the report as blue team readiness, not just "we got a shell."
Conclusion
Kubernetes IR that stops at audit logs and image scans assumes threat actors write to disk and call the API like a polite citizen. Plenty of them do not.
Add memory capture to the playbook: AVML on the cordoned node, inventory with crictl/kubectl, Volatility 3 for process and injection artifacts, then rebuild. Practice the symbol-table friction on a lab AMI before production hands you a huge .lime file and a war room.
Audit logs tell you who asked the API for what. Memory tells you what was still breathing when you finally looked. And a planted marker lab is how you prove the capture path works before the real token shows up only in RAM.
Further Reading
- Volatility Foundation / Volatility 3
- Microsoft AVML
- Cado VARC (volatile artifact collector, including container-friendly collection)
- Earlier on this blog: Kubernetes IR playbook (audit logs), Kubernetes runtime security (Falco)